Map vectorization
Turn features printed on exploration maps into geographic points, lines, and polygons you can inspect, filter, and export.
Work with the features inside a map
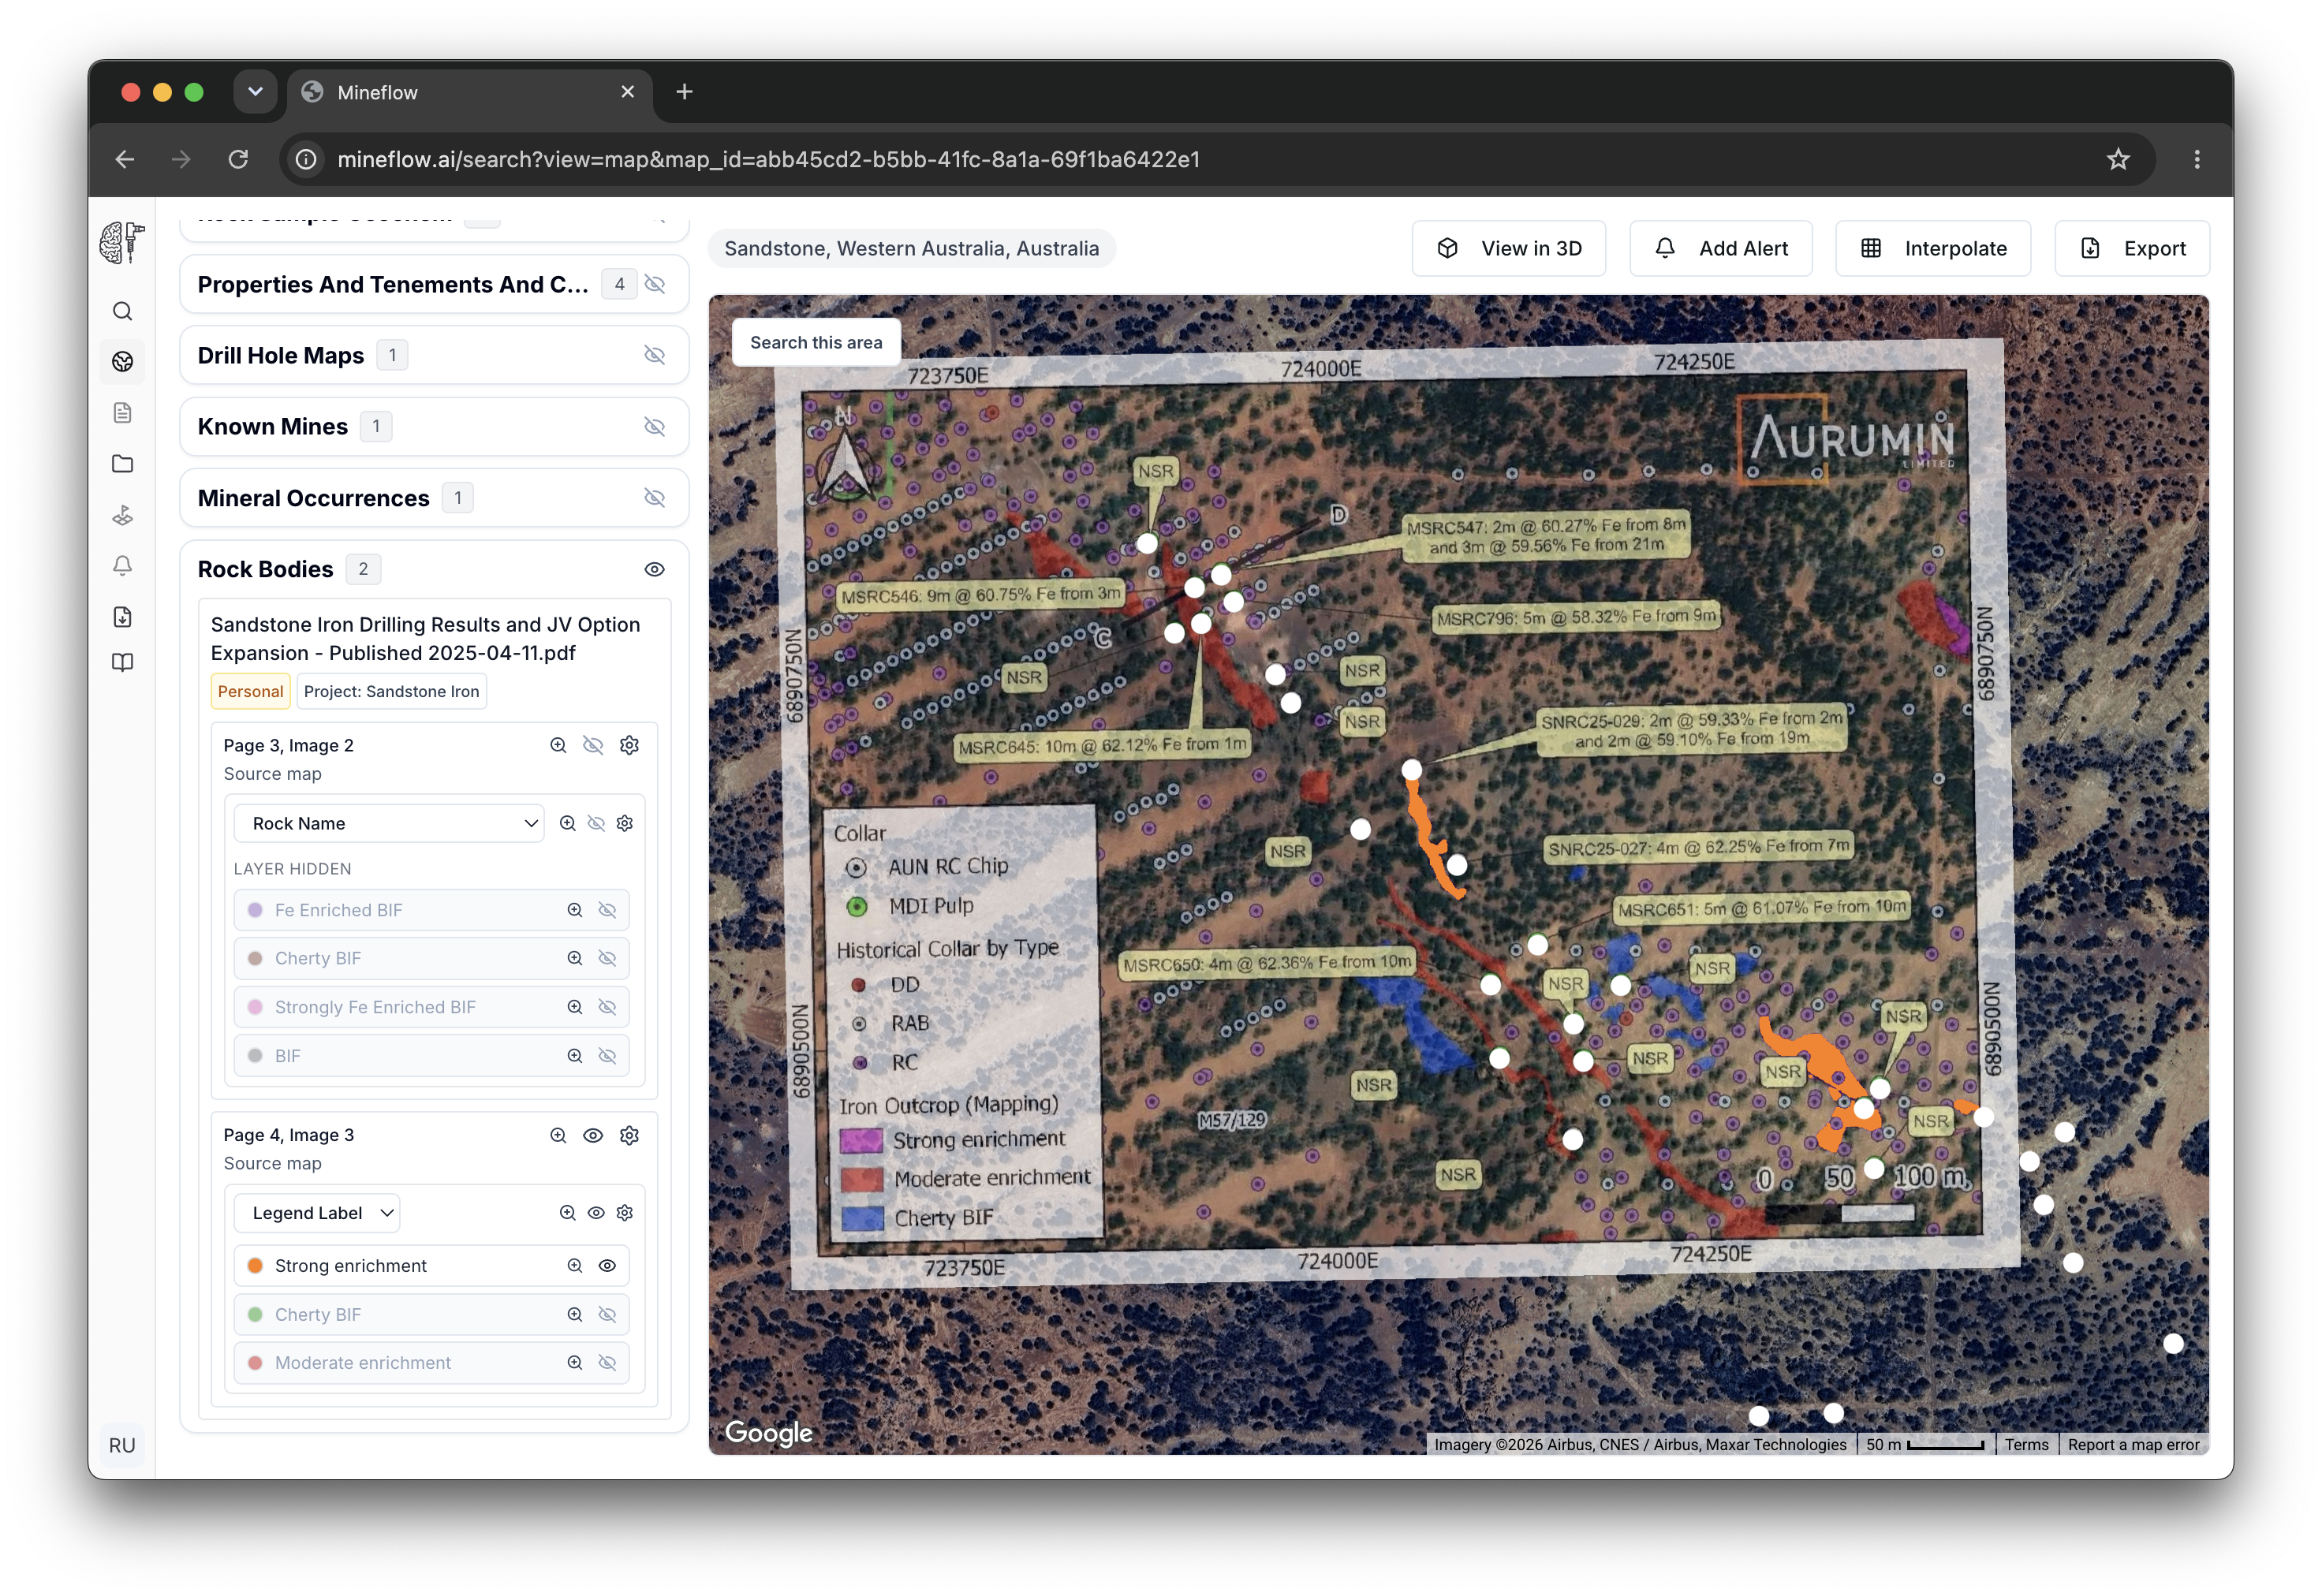
A geological map in a report may contain rock units, interpreted faults, sample locations, and mineral occurrences. Mineflow can read its legend and extract supported features into separate map layers. You can then compare those features with drilling and other surveys without tracing each shape by hand.
Georeferencing positions the source image on the Earth. Vectorization extracts the features within that image and uses its geographic placement. The source map stays available so you can check the result against the original interpretation.
Explore Canadian geological survey maps
Compare three Geological Survey of Canada maps from our extraction demo. Grab the divider directly on each map and drag left or right to compare a selected feature class with the original sheet. The legends, coordinates, and map notes stay in place.
Rock units: Prosperous Lake
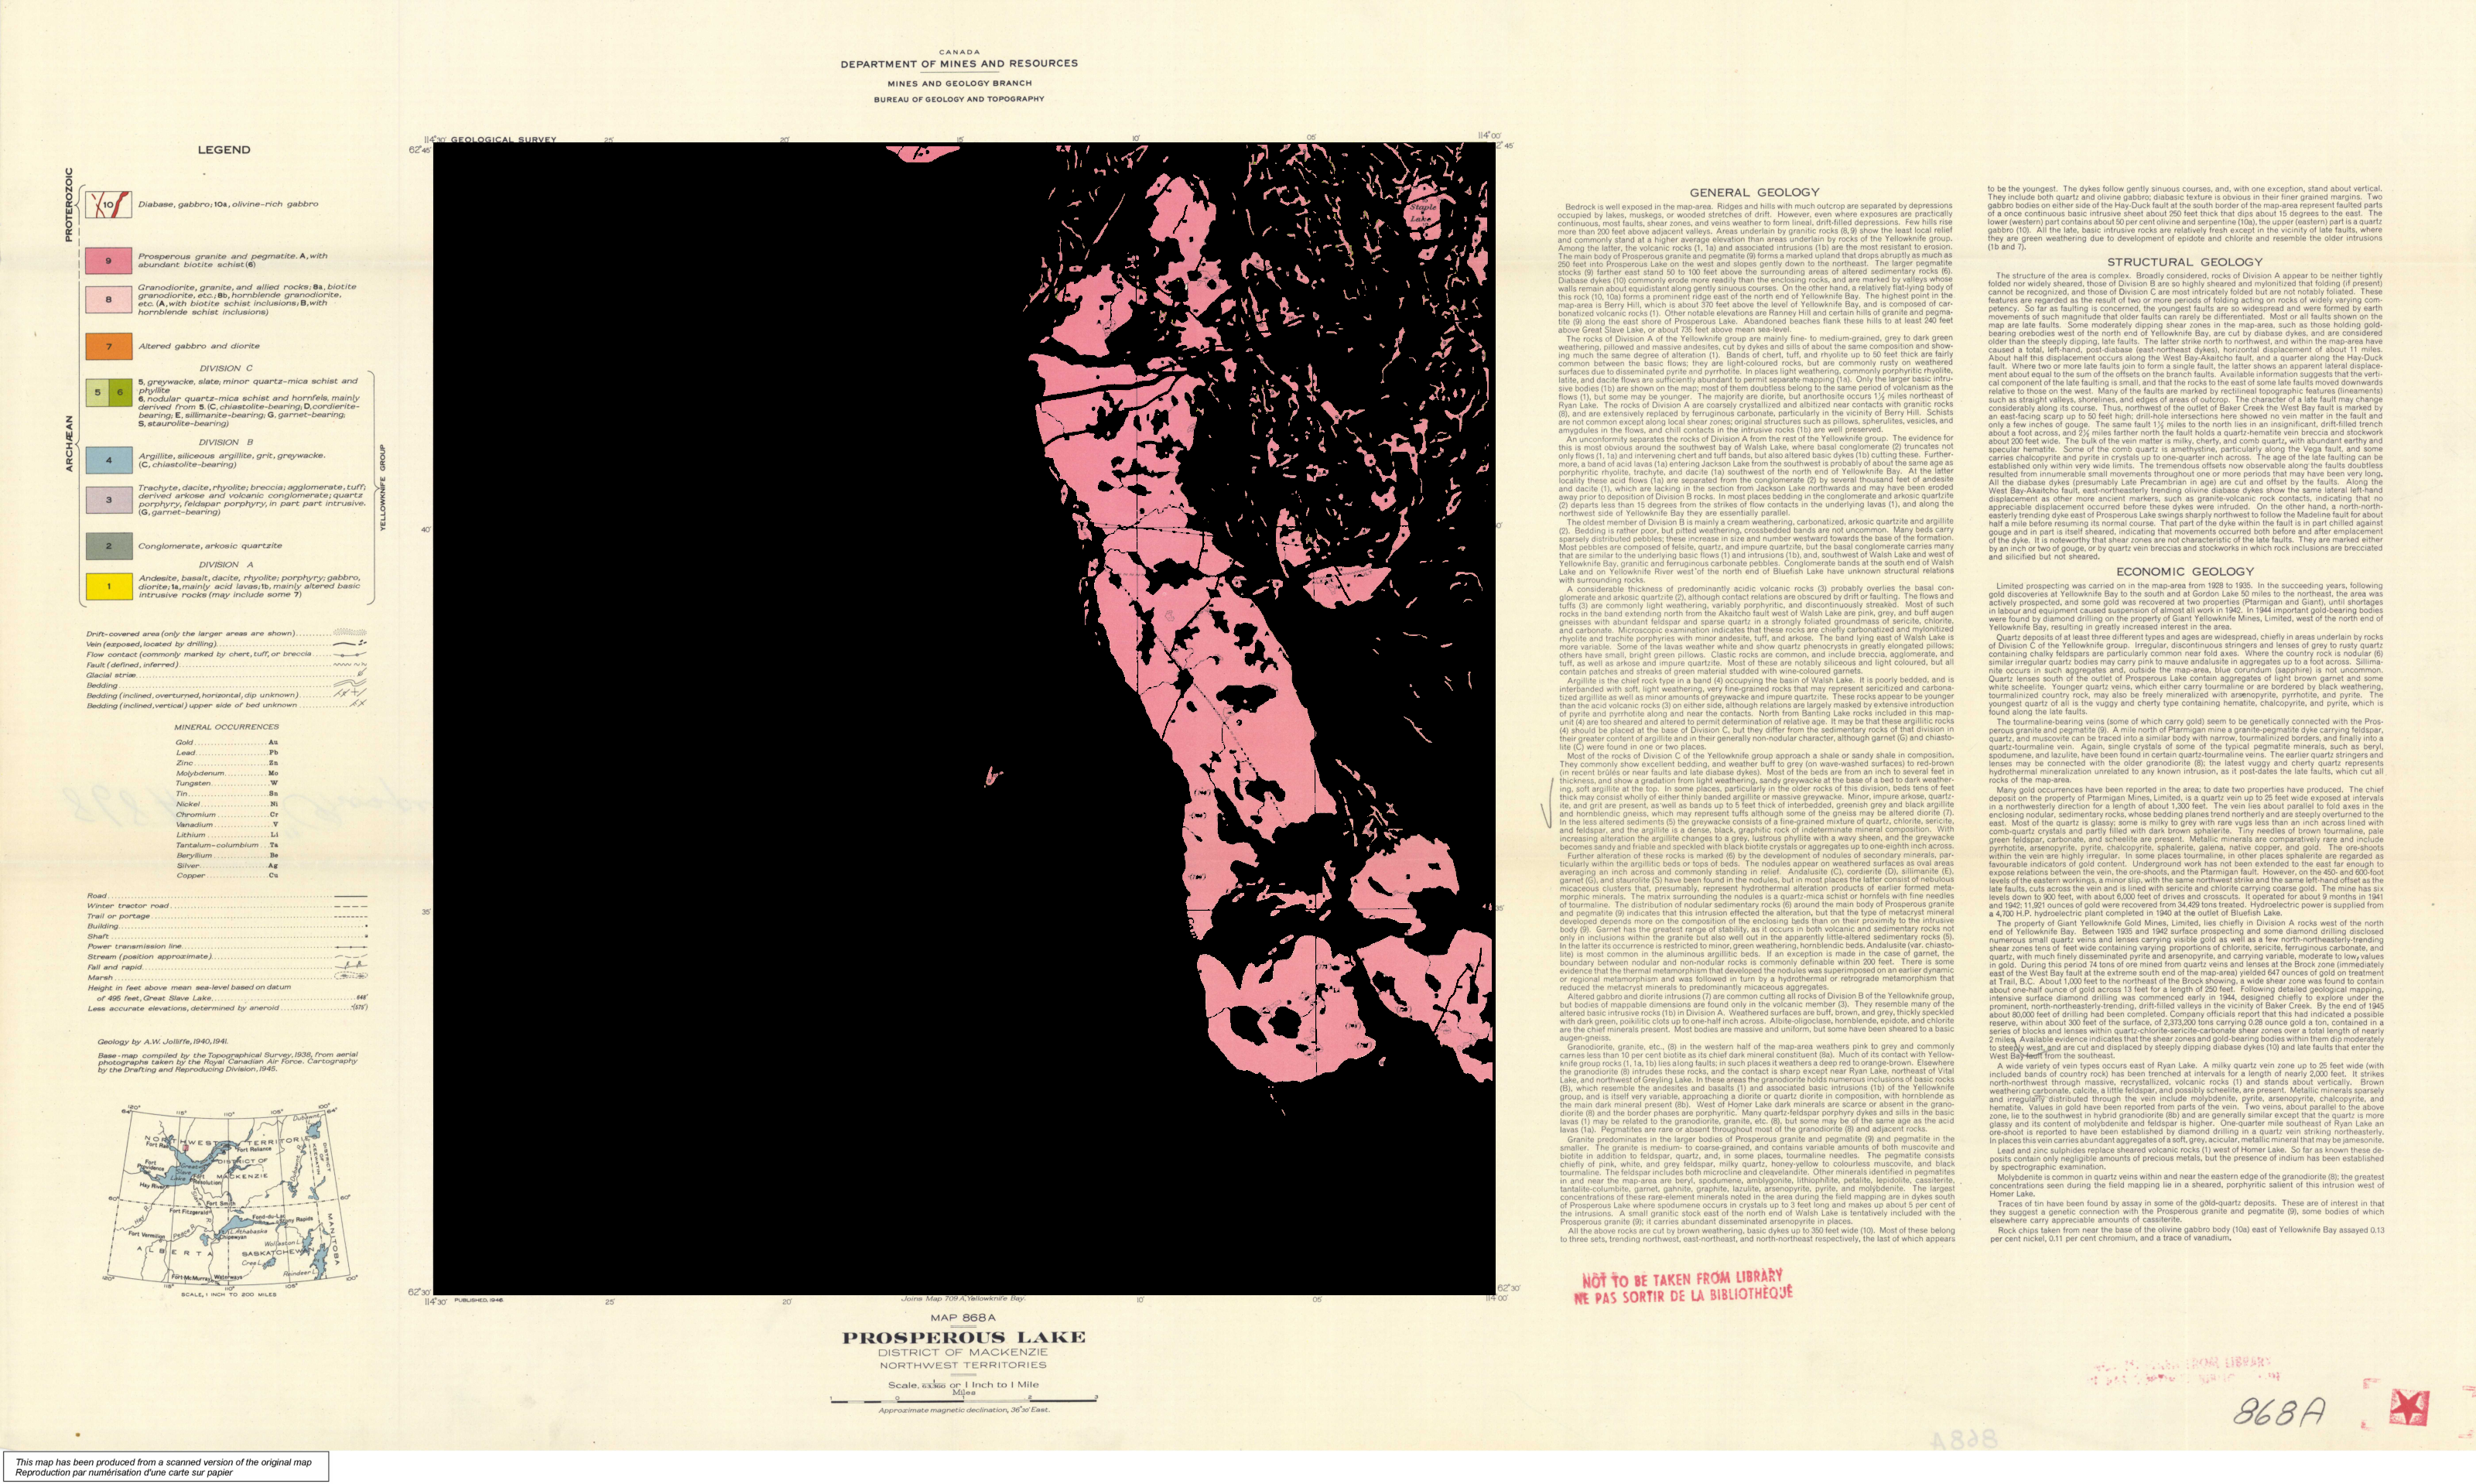
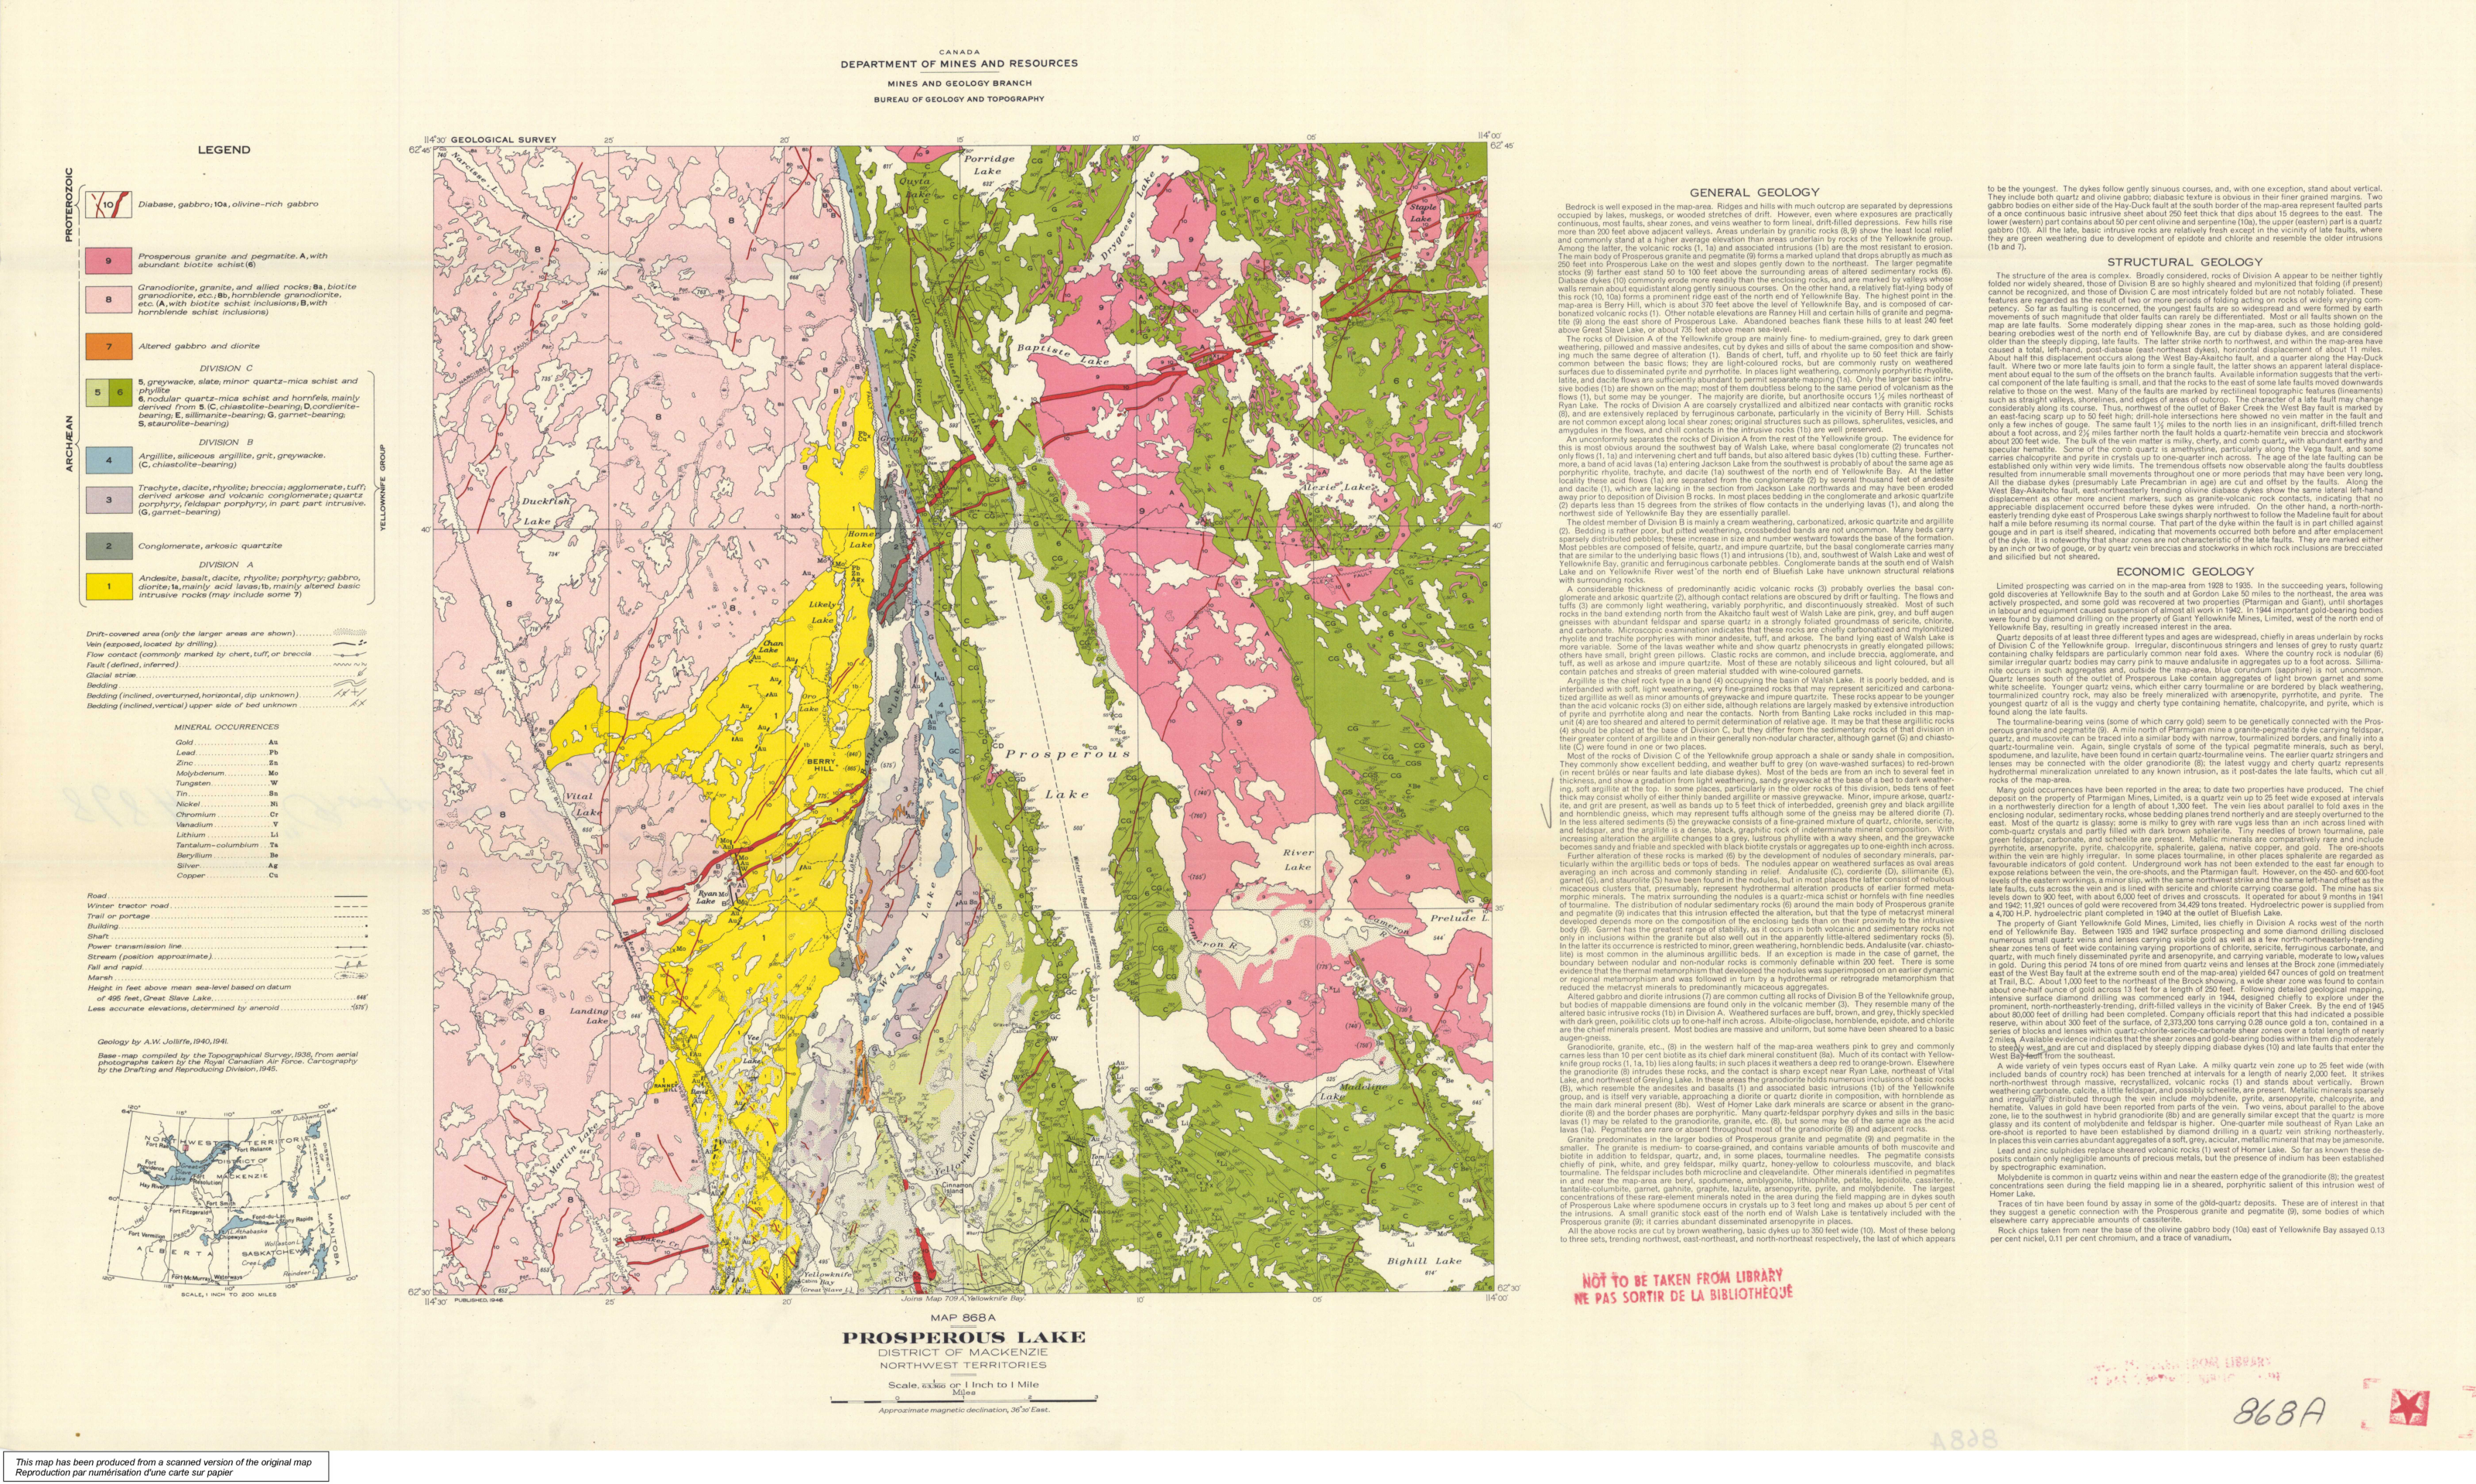
Drag the divider, or use the arrow keys to compare. Home shows the full extraction; End shows the full original.
The rose-coloured Prosperous granite and pegmatite (unit 9) is separated from the surrounding rock units, lakes, and dykes. The printed legend stays visible for comparison.
Source: Geological Survey of Canada / Natural Resources Canada. Publication record.
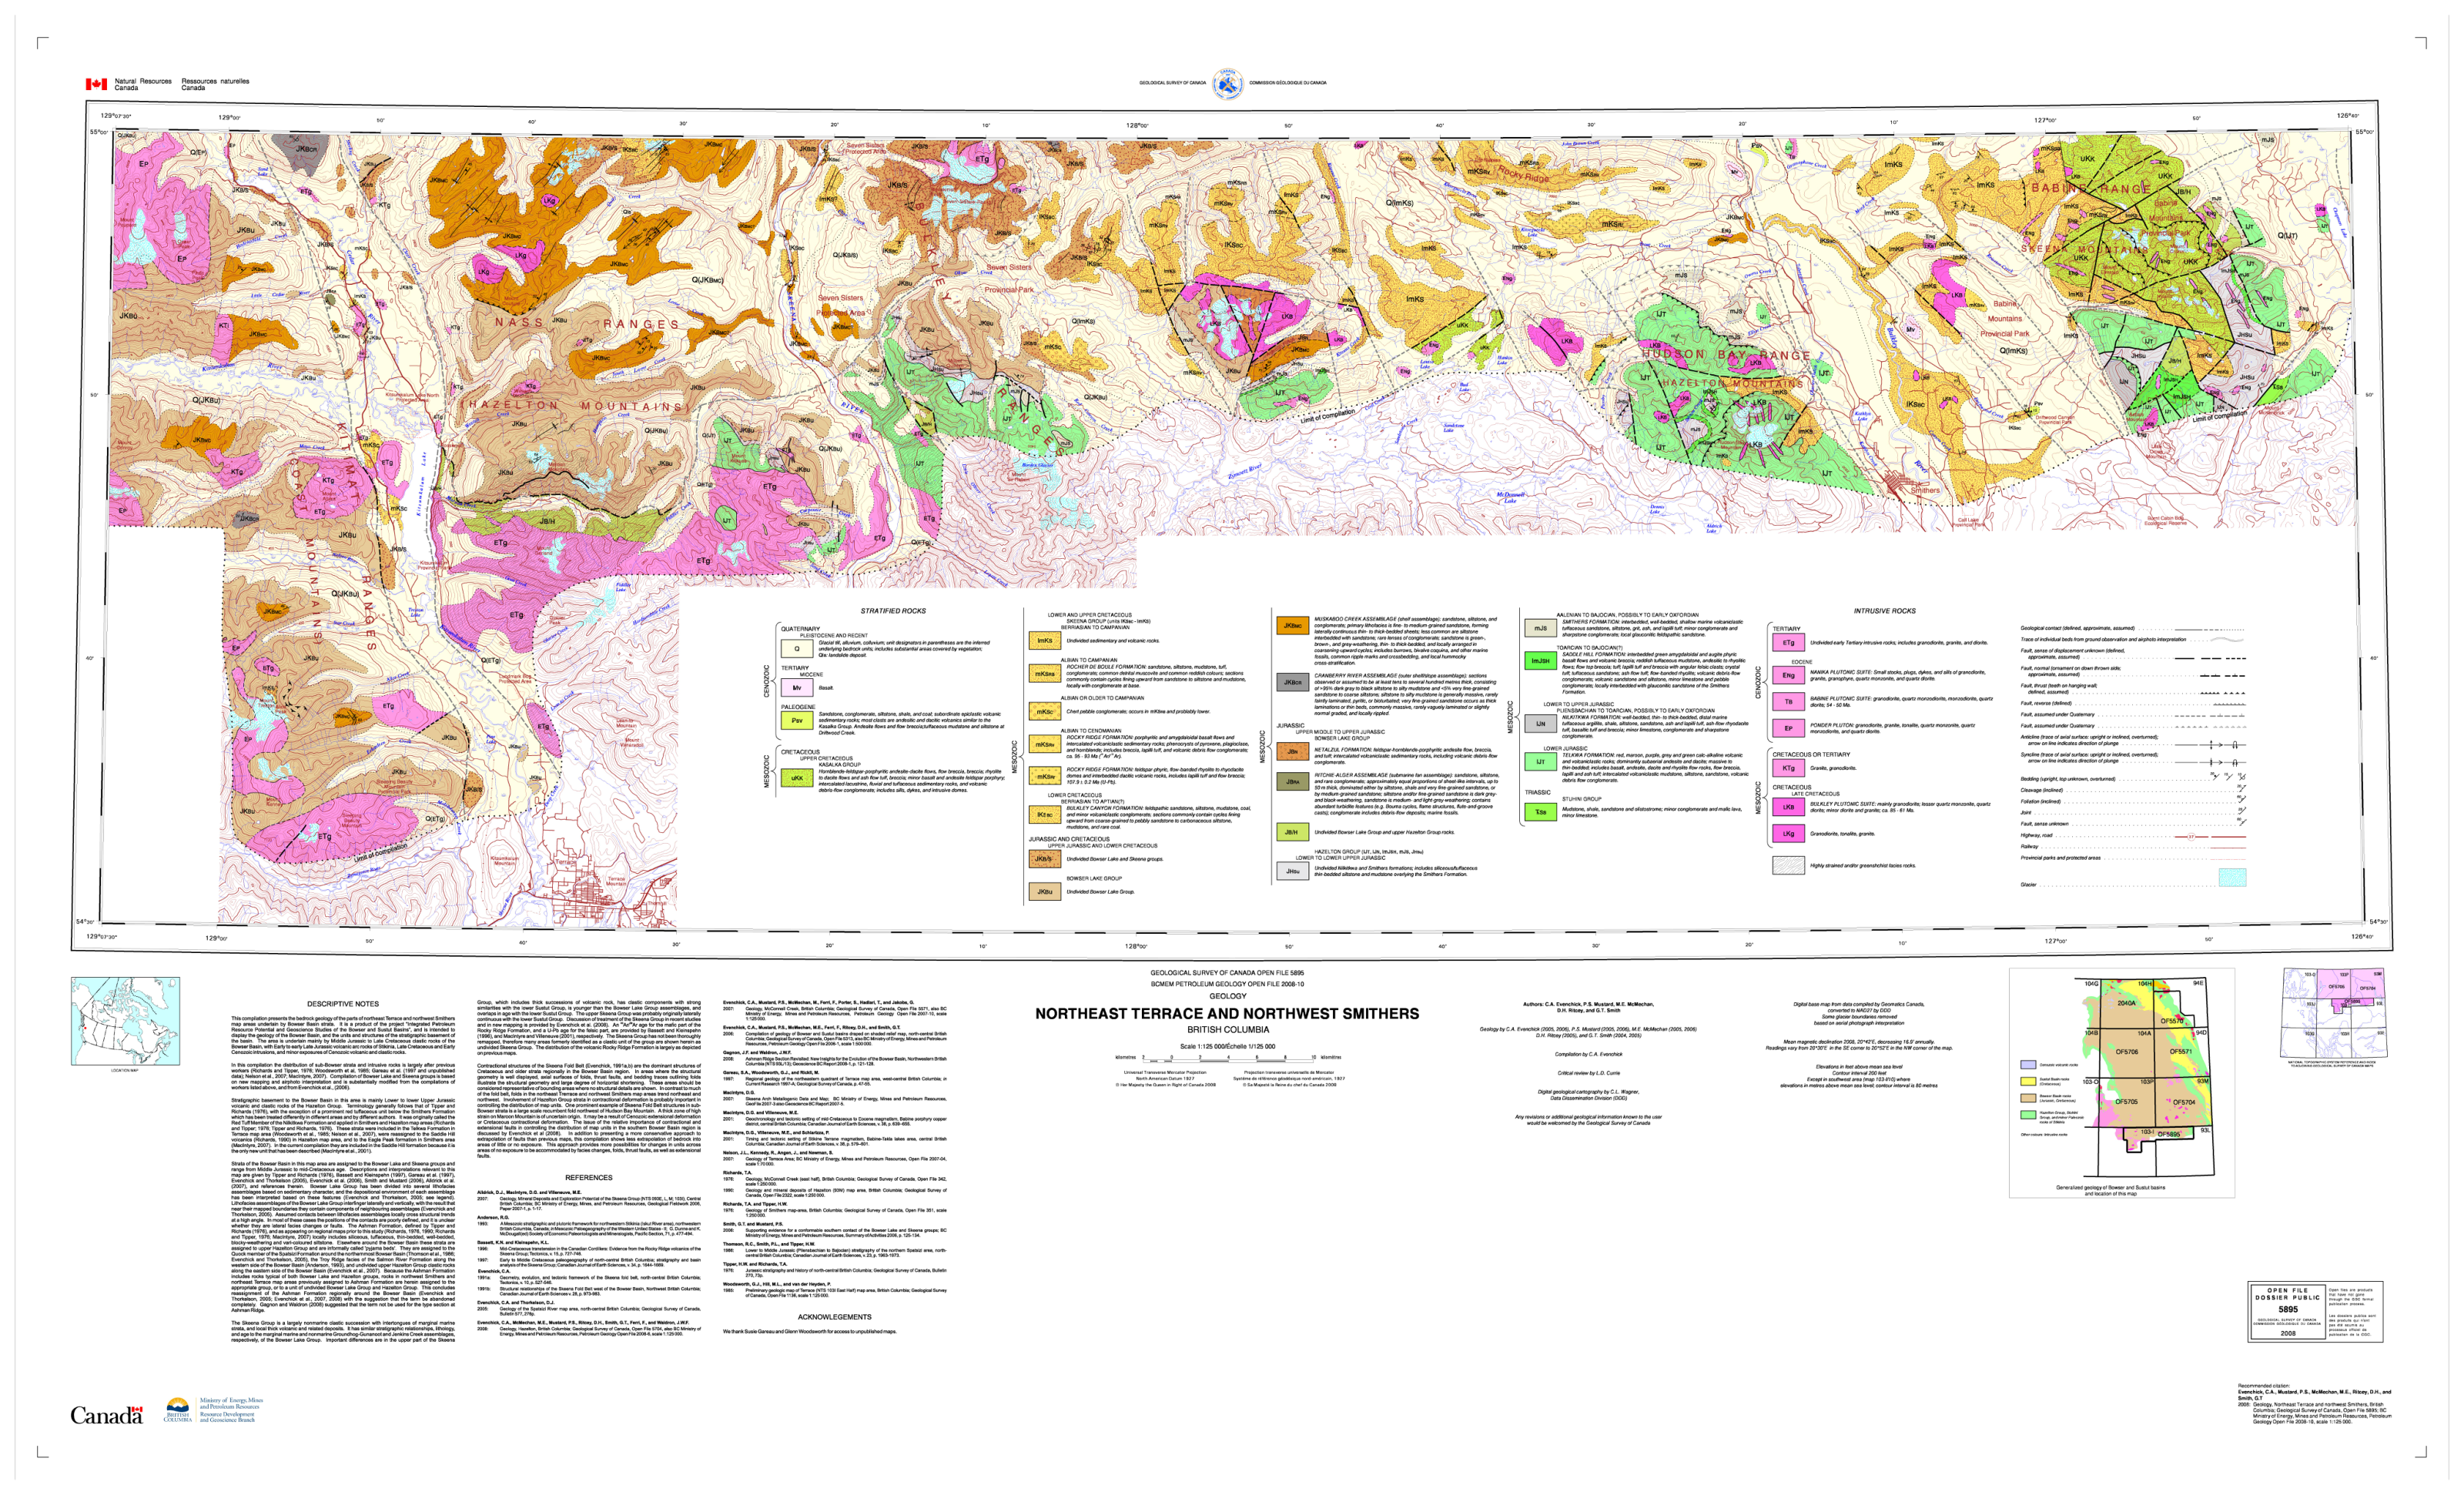
Fault traces: Northeast Terrace and Northwest Smithers
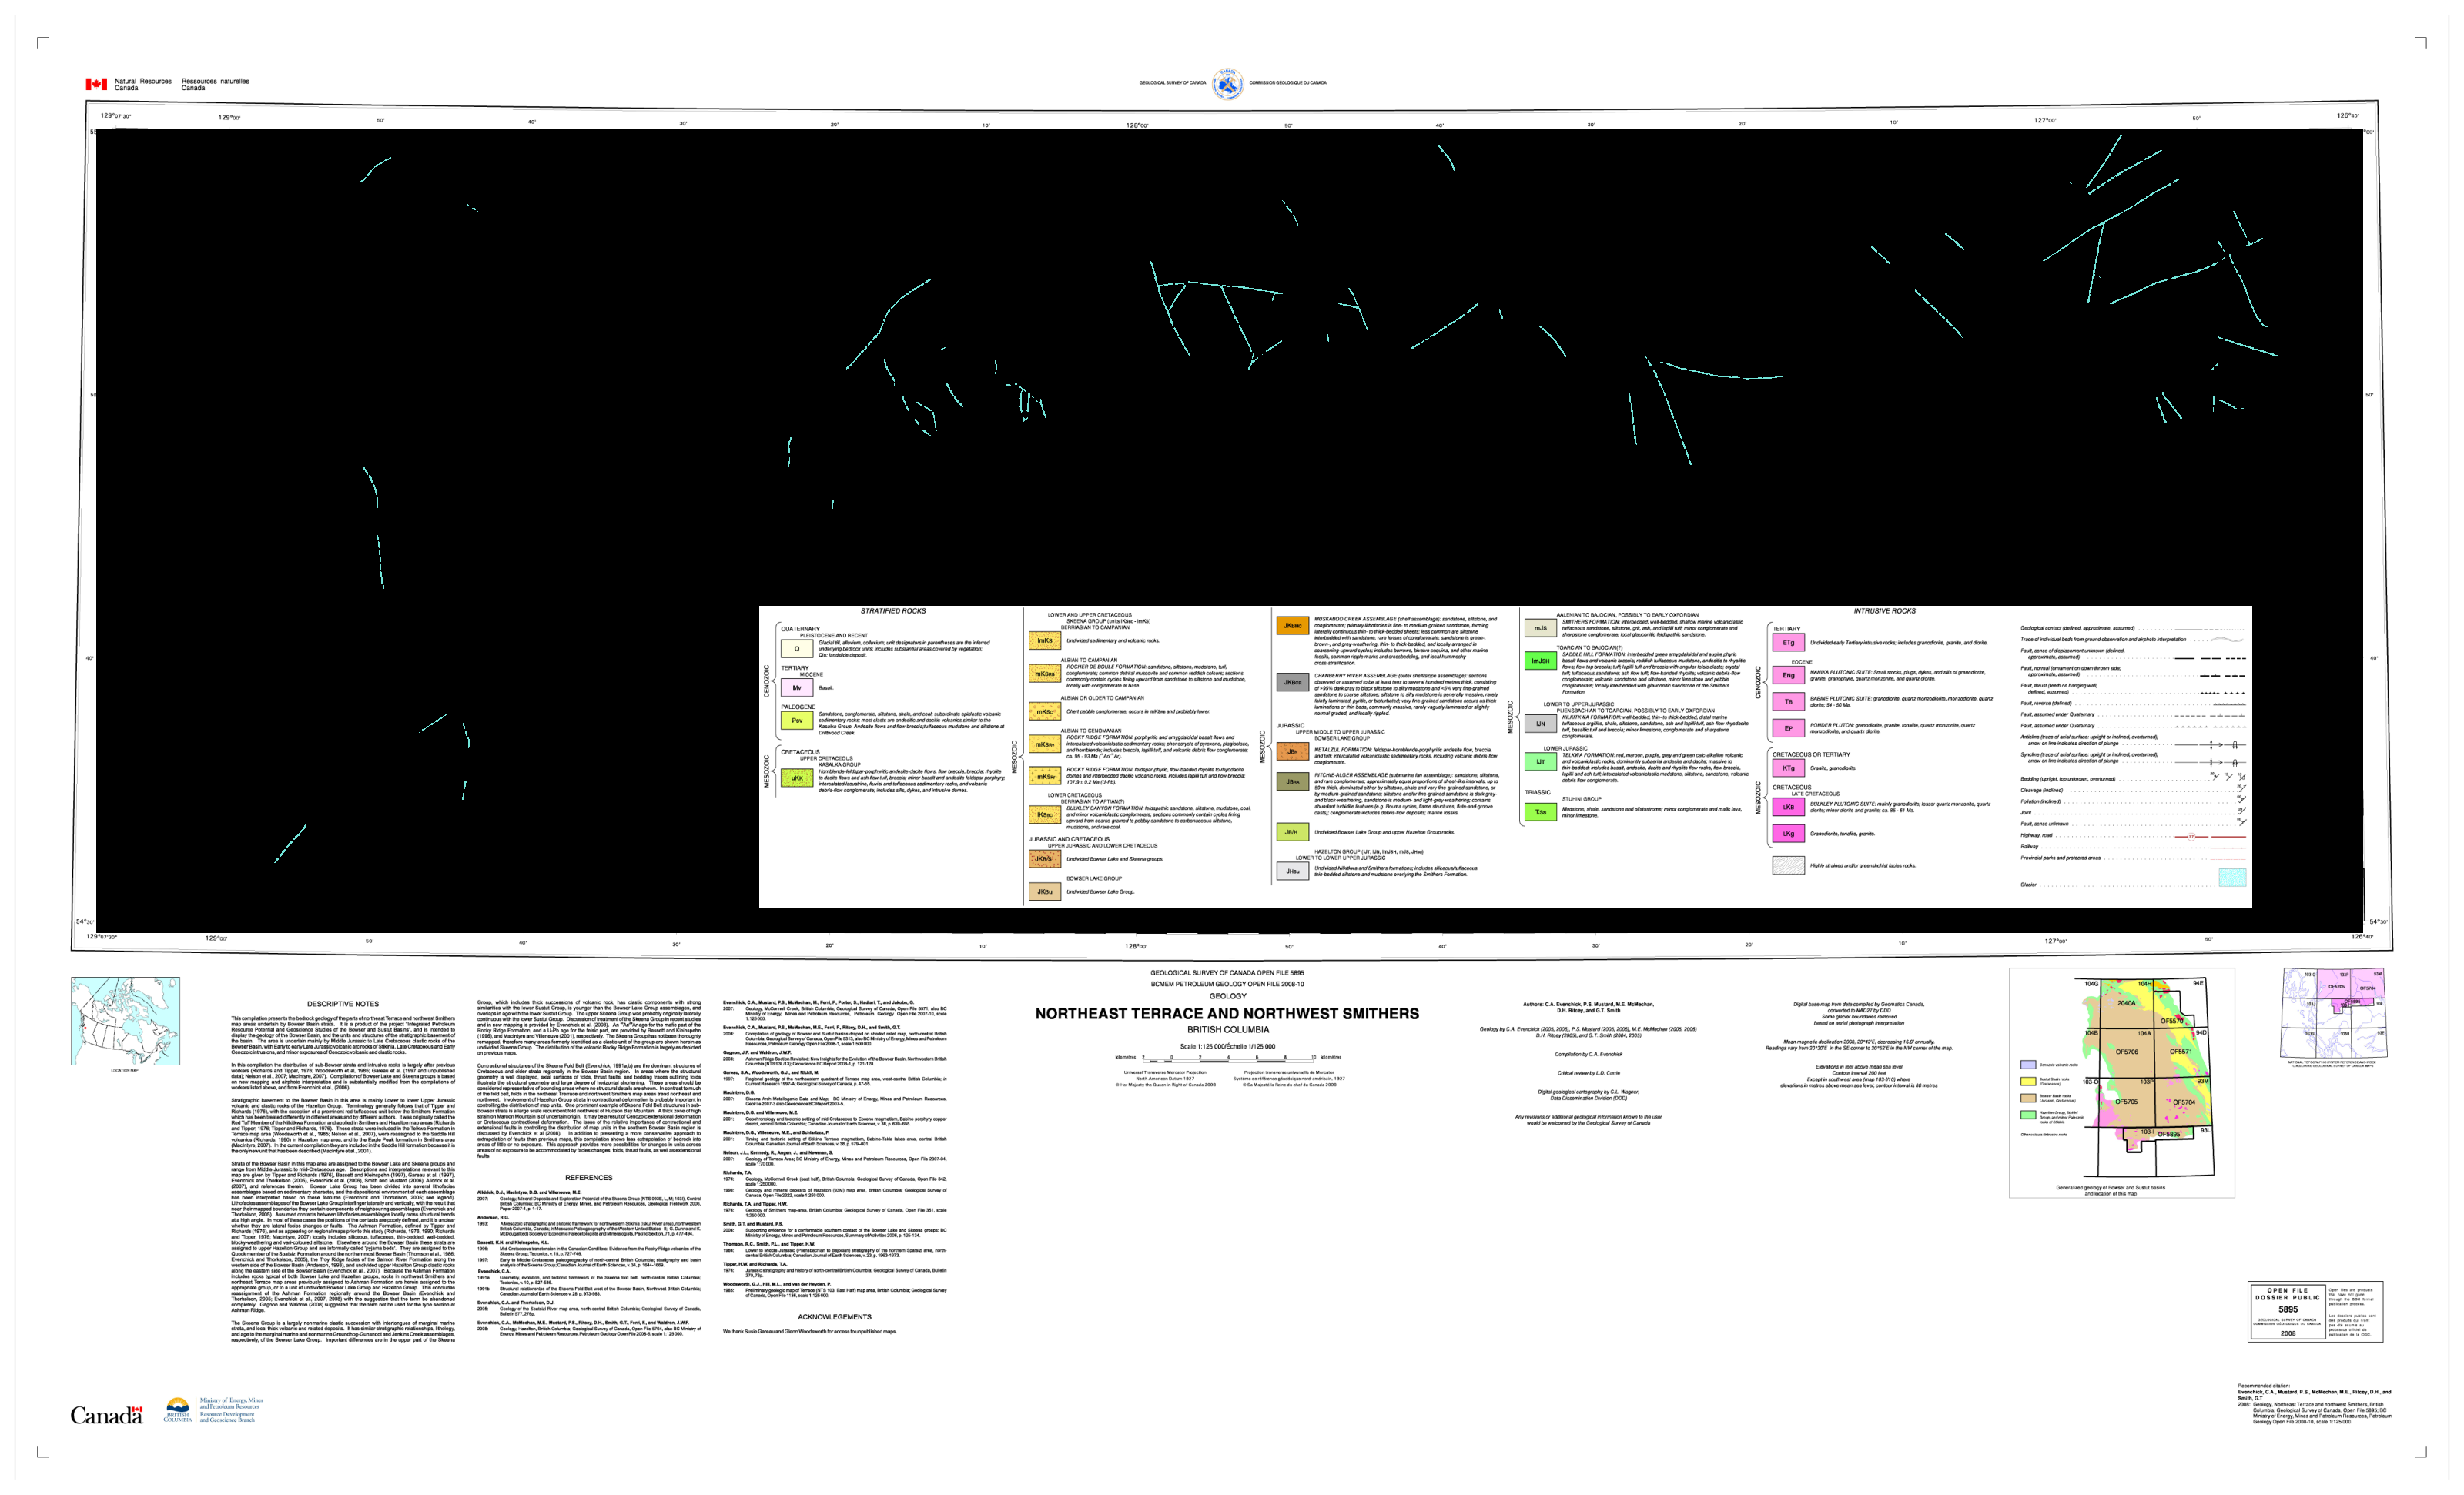
Drag the divider, or use the arrow keys to compare. Home shows the full extraction; End shows the full original.
Selected fault traces appear in cyan, separate from geological contacts, contours, and labels. Fine or interrupted traces can remain incomplete; check them against the original sheet.
Source: Geological Survey of Canada / Natural Resources Canada. Publication record.
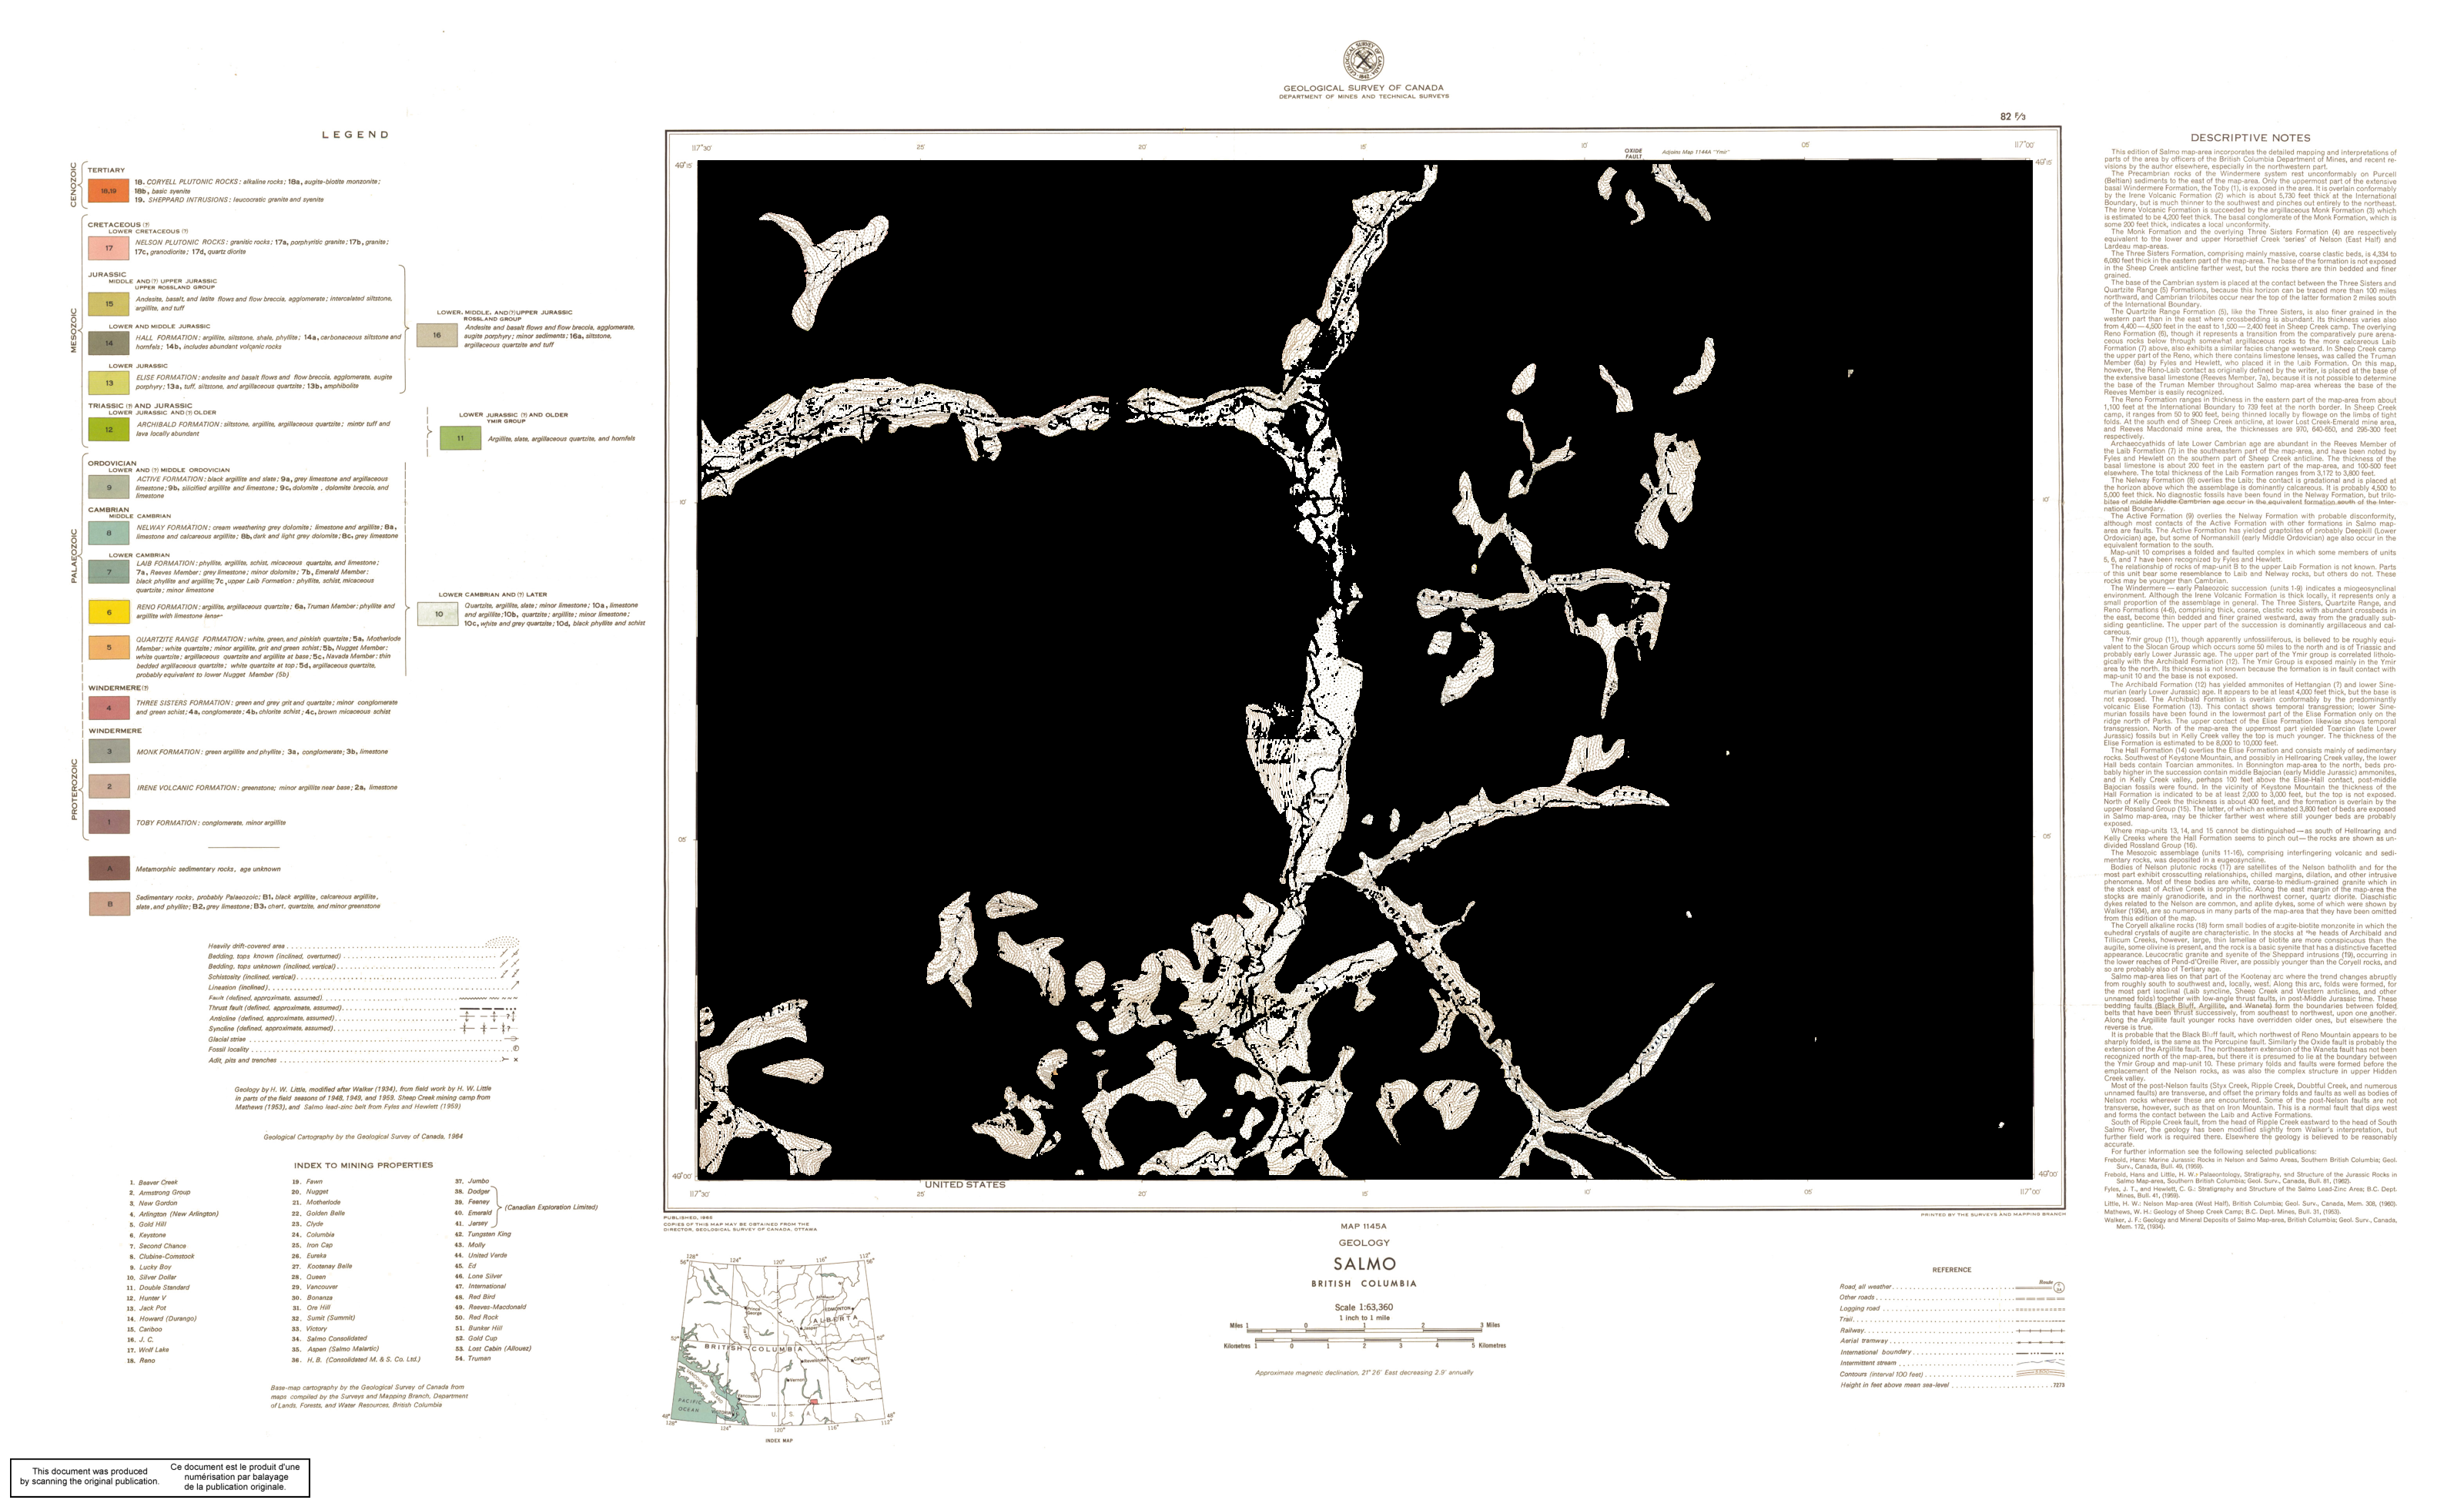
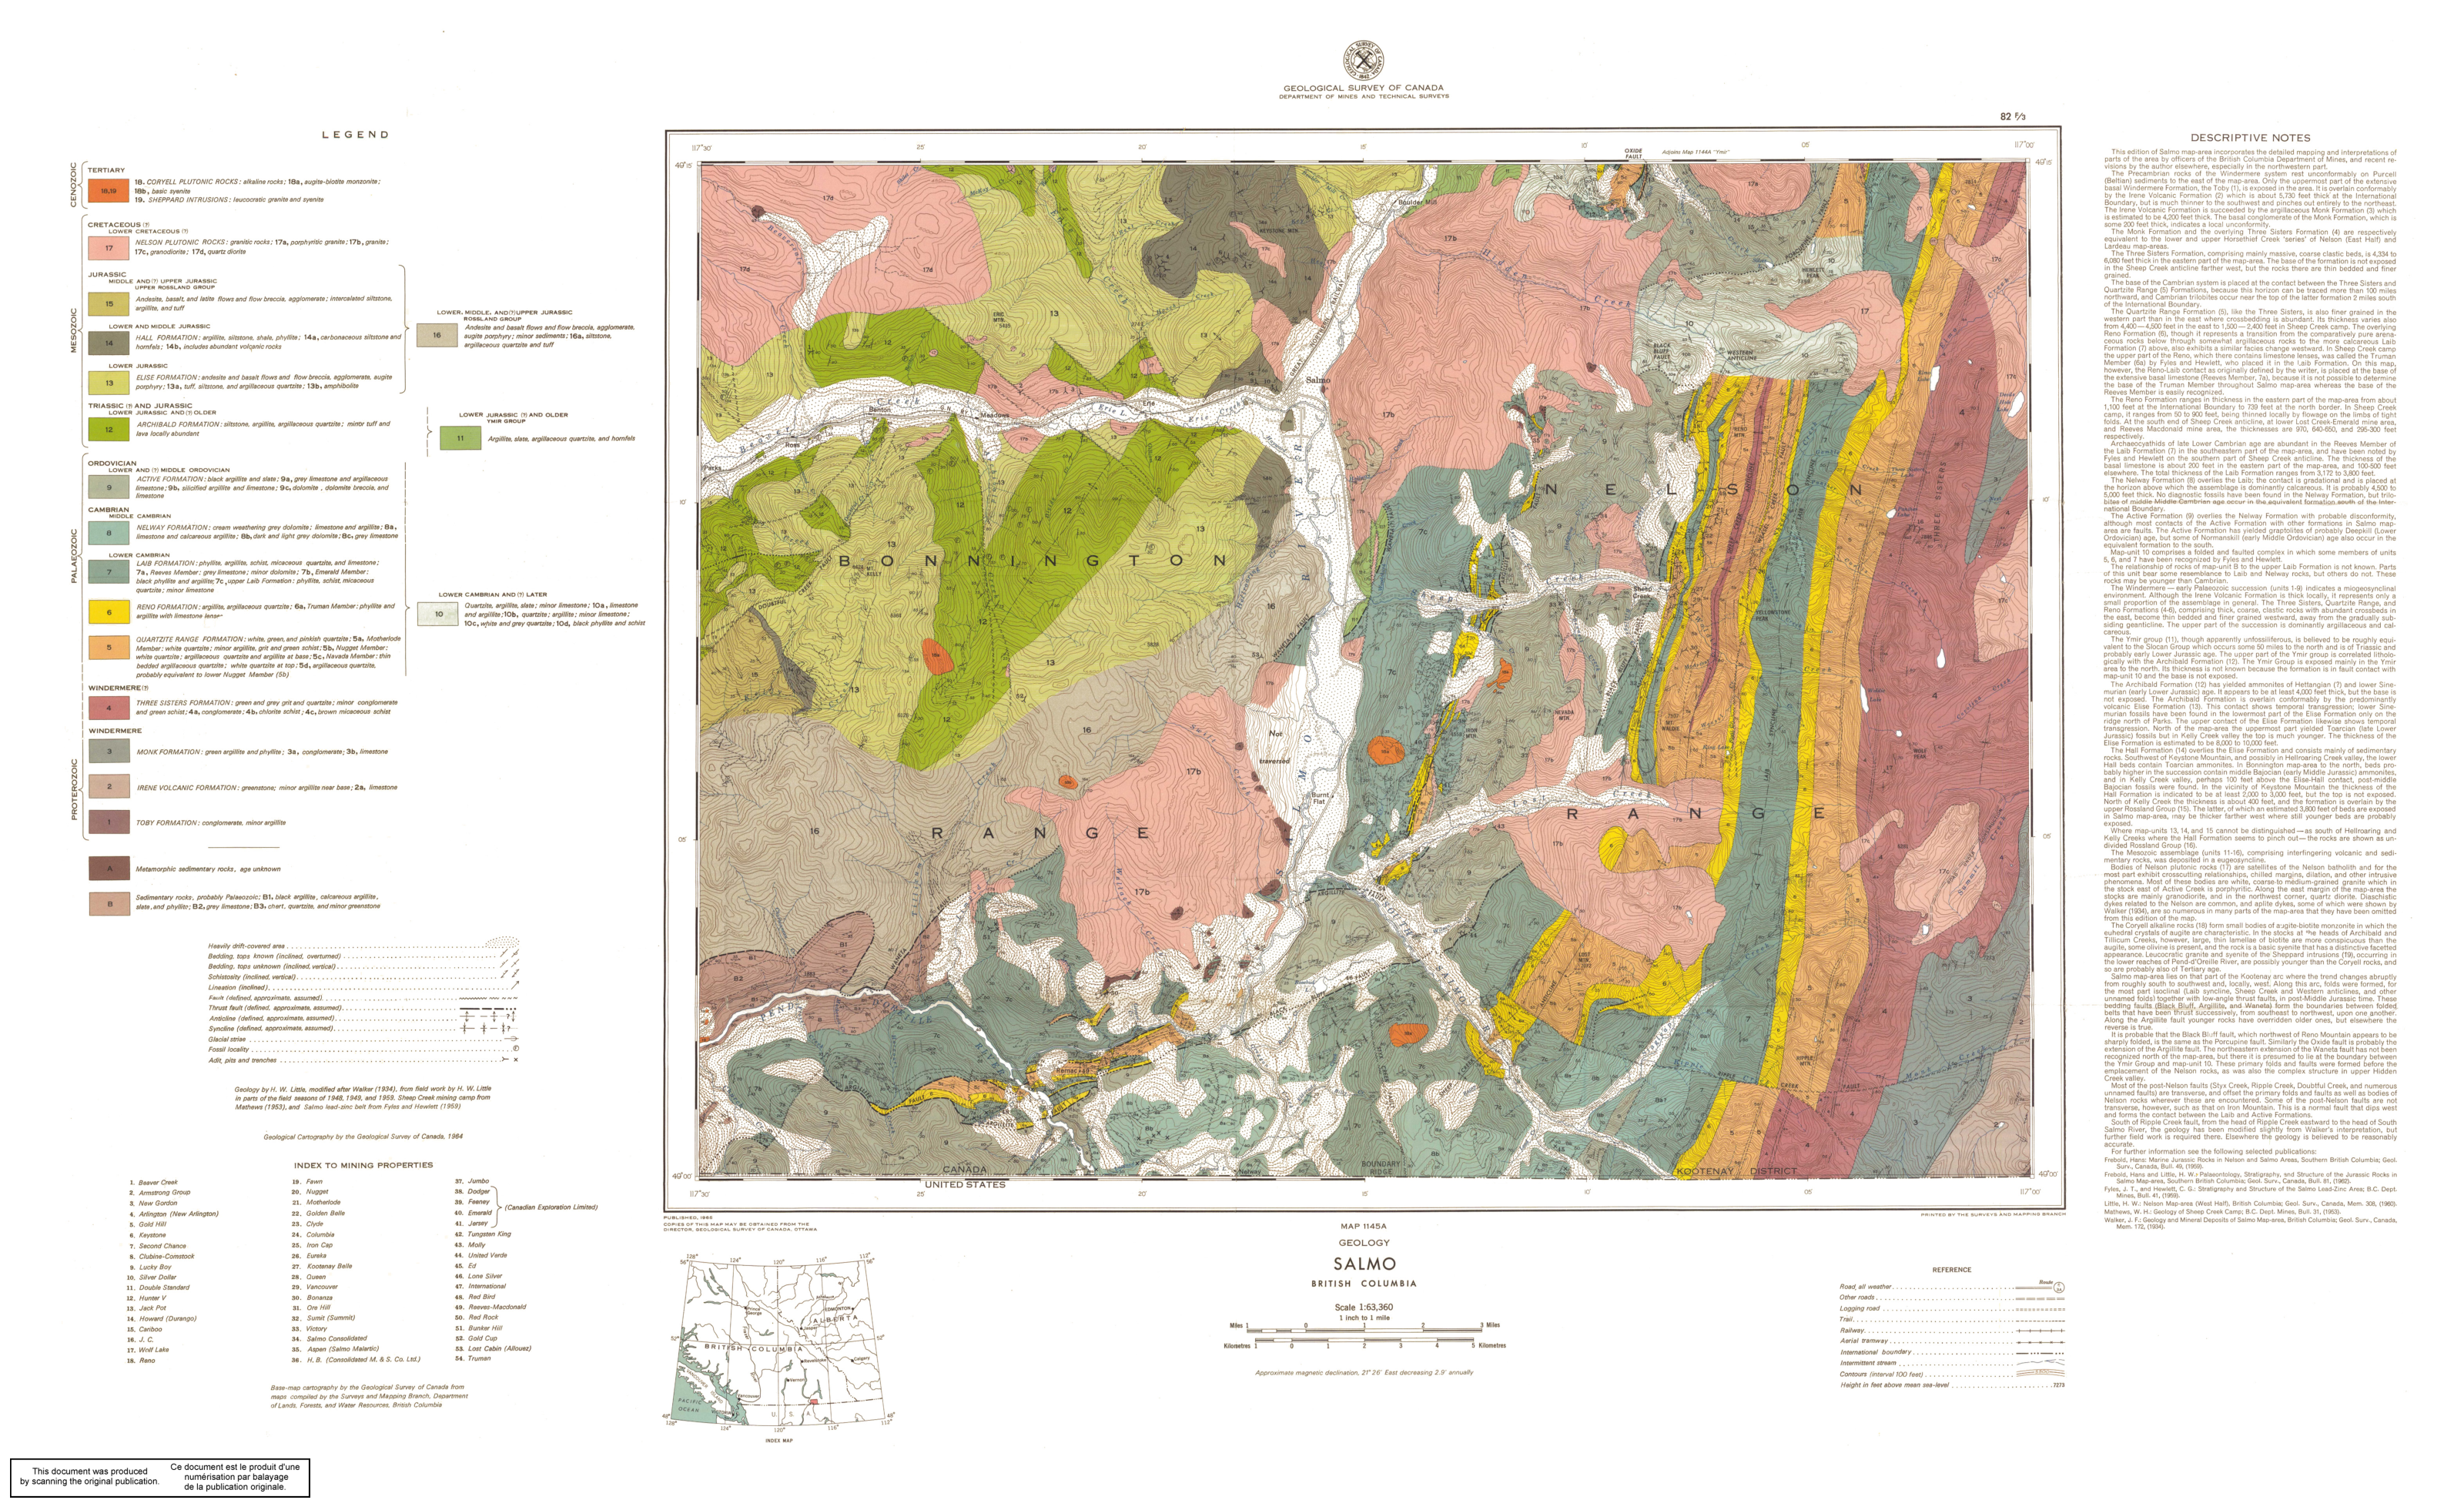
Patterned cover: Salmo
Drag the divider, or use the arrow keys to compare. Home shows the full extraction; End shows the full original.
The stippled, heavily drift-covered areas are isolated from the coloured bedrock units. This example shows extraction from a printed pattern as well as a colour fill.
Source: Geological Survey of Canada / Natural Resources Canada. Publication record.
Explore maps from ASX announcements
Company announcements contain useful map features too. These three examples from our demo show rock units, vein traces, and historical mine symbols extracted from ASX announcements. Drag each divider to compare the original map figure with its selected features. The legends and annotations stay visible, and each example links to its source announcement.
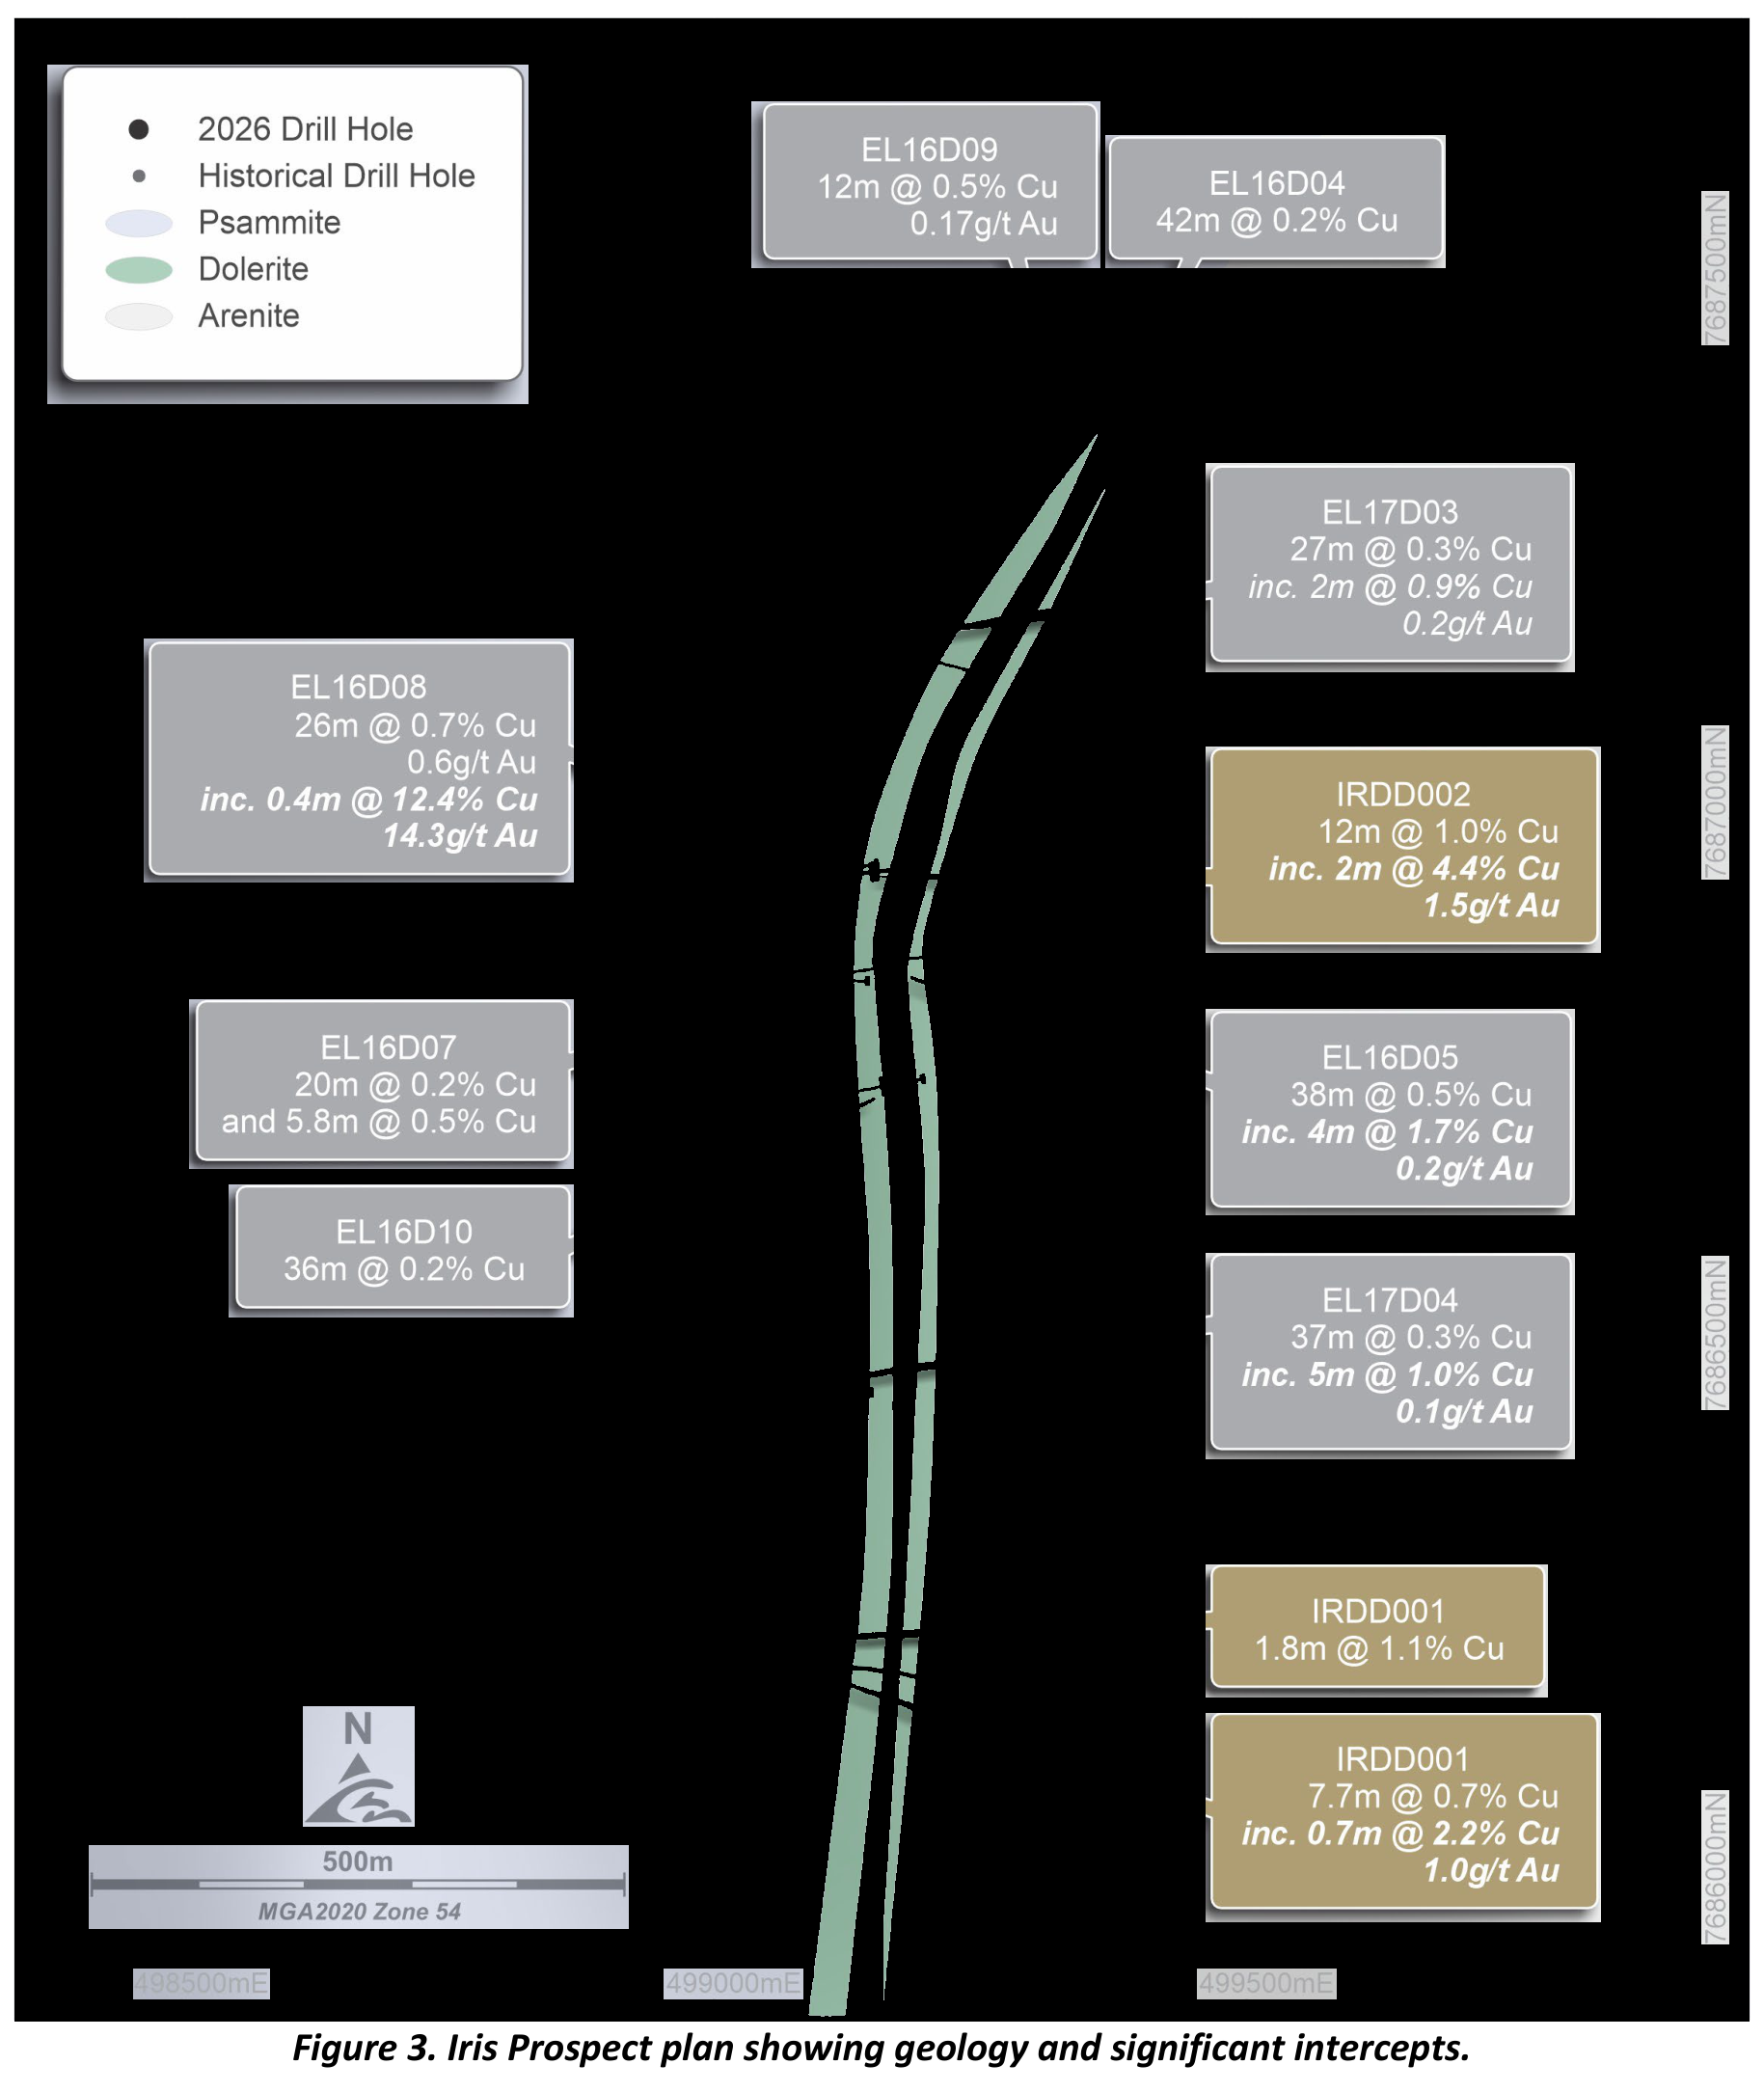
Dolerite bands: AIC Mines, Iris prospect
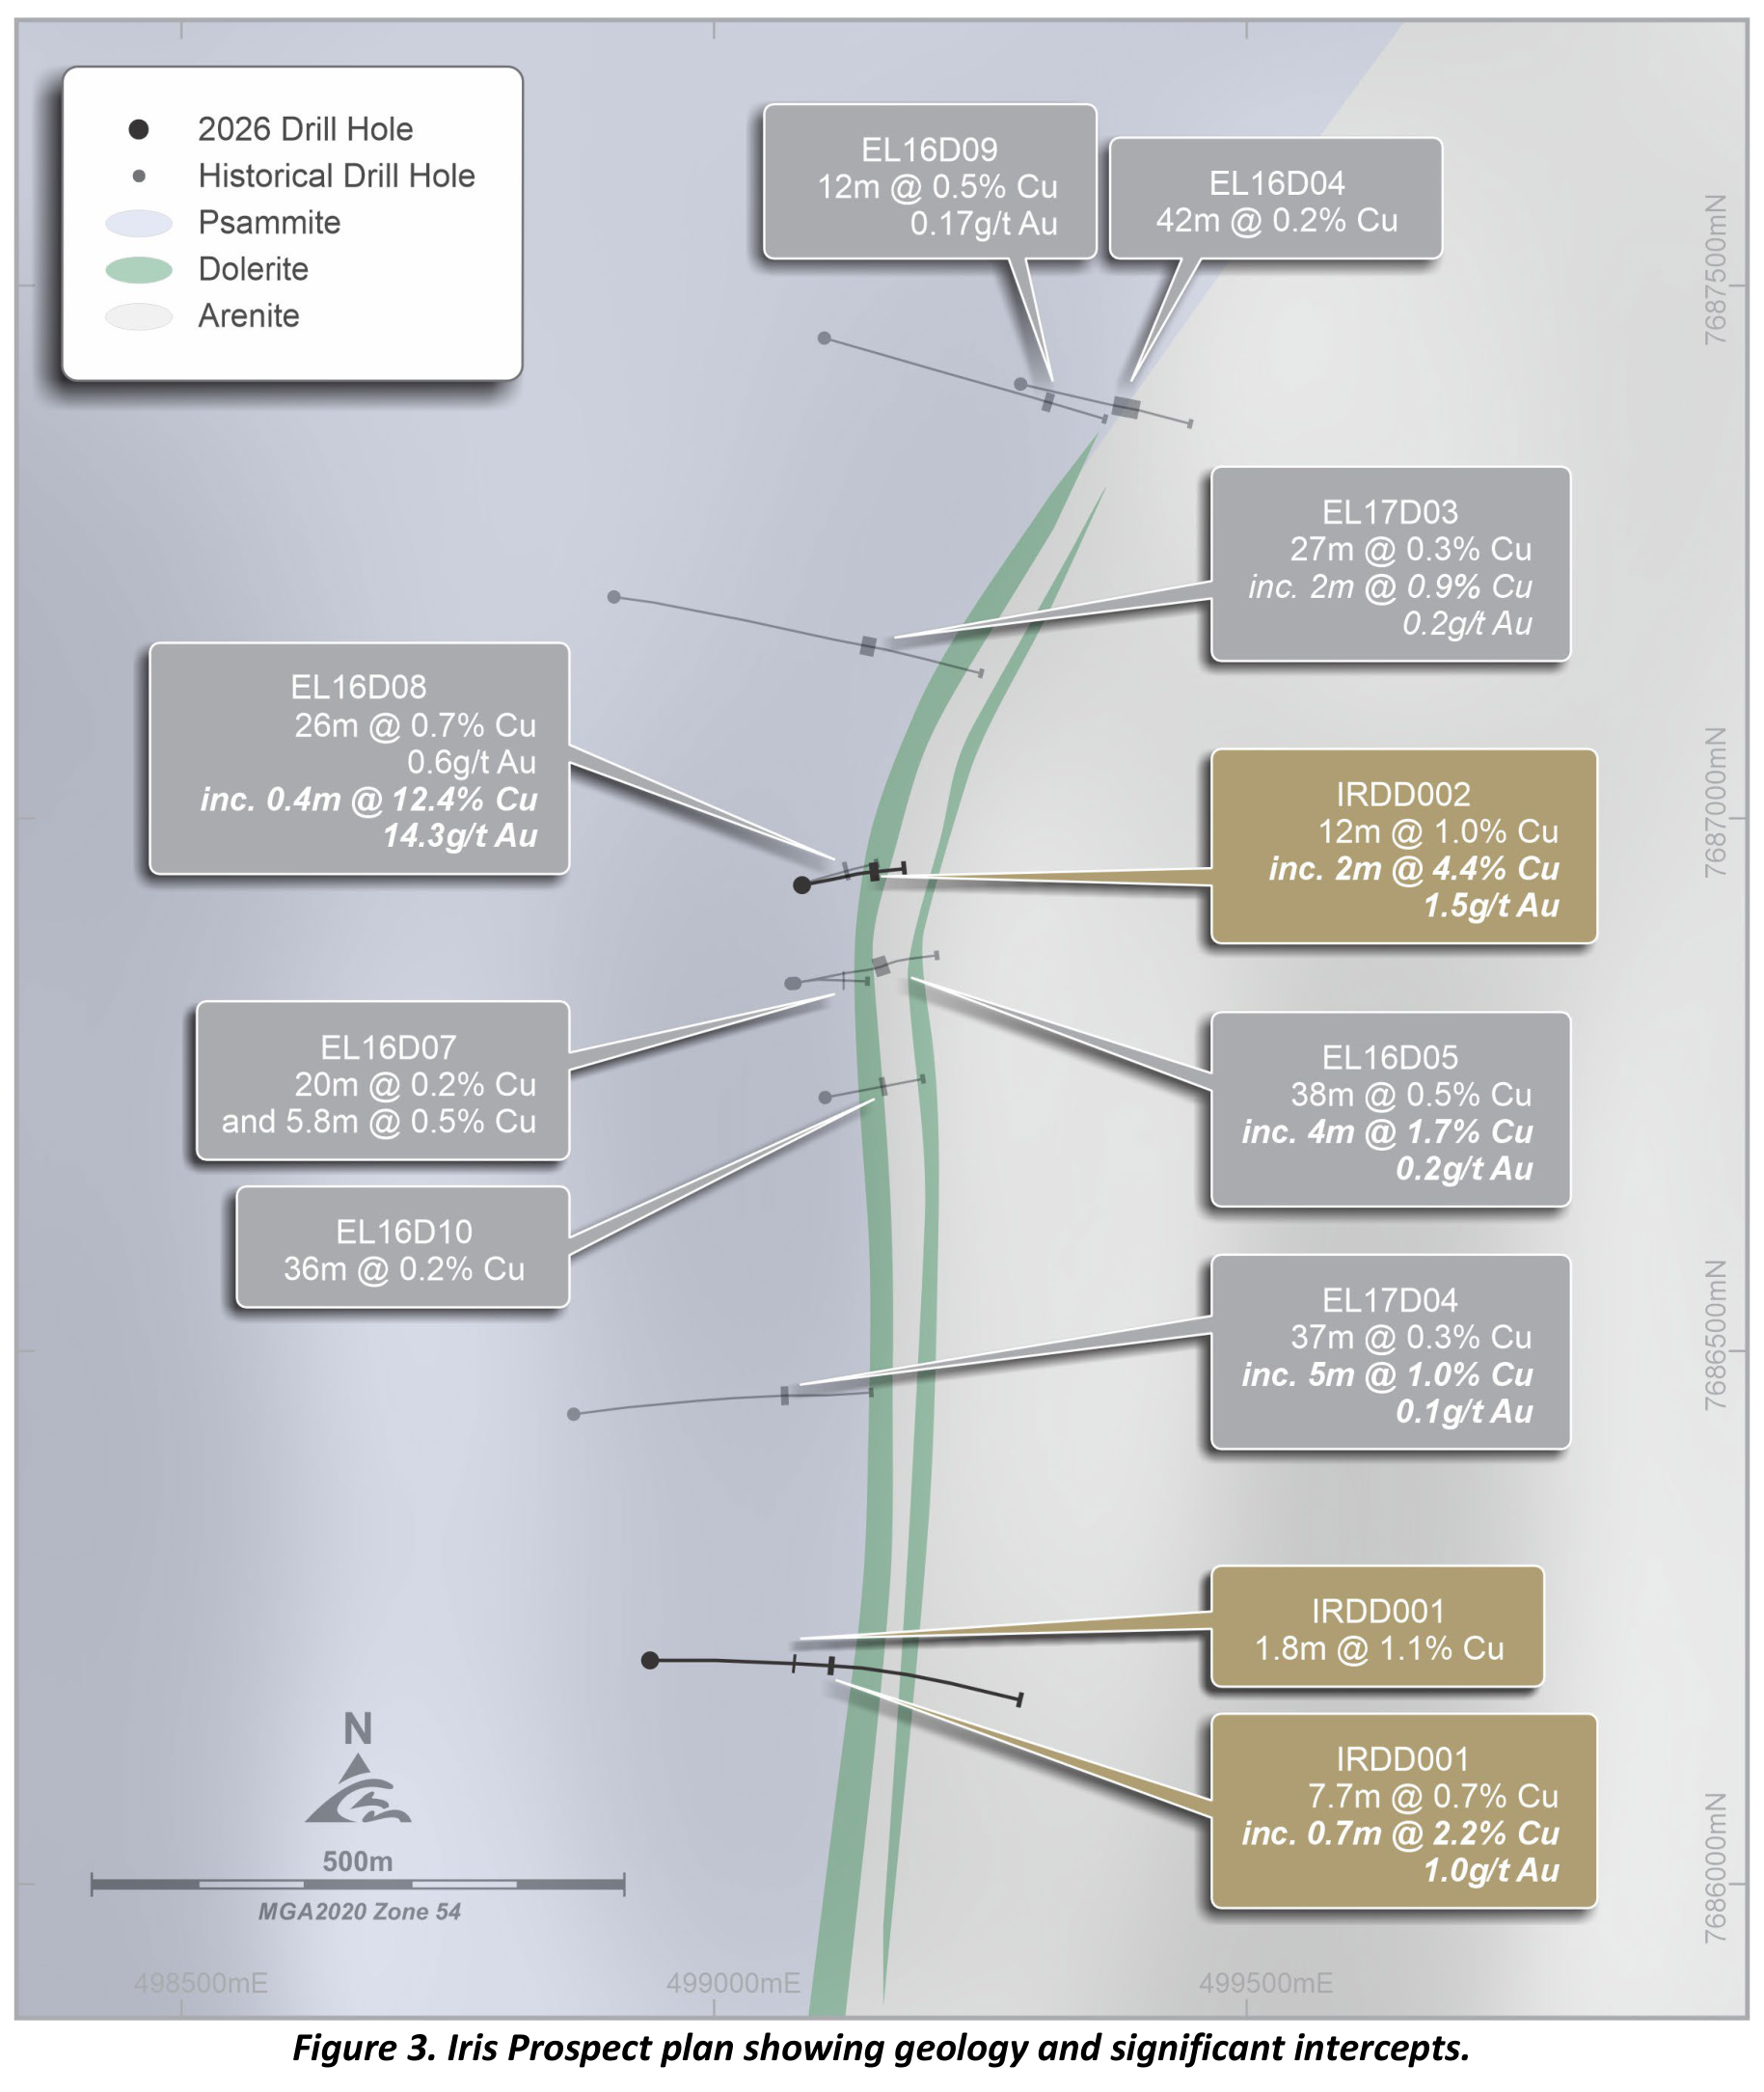
Drag the divider, or use the arrow keys to compare. Home shows the full extraction; End shows the full original.
The two green dolerite bands are isolated from the surrounding rock units. Drill traces and intercept labels remain useful reference points; where they cover the geology, the extracted bands can be interrupted.
Source: AIC Mines. ASX announcement.
Vein traces: Iltani Resources, Orient
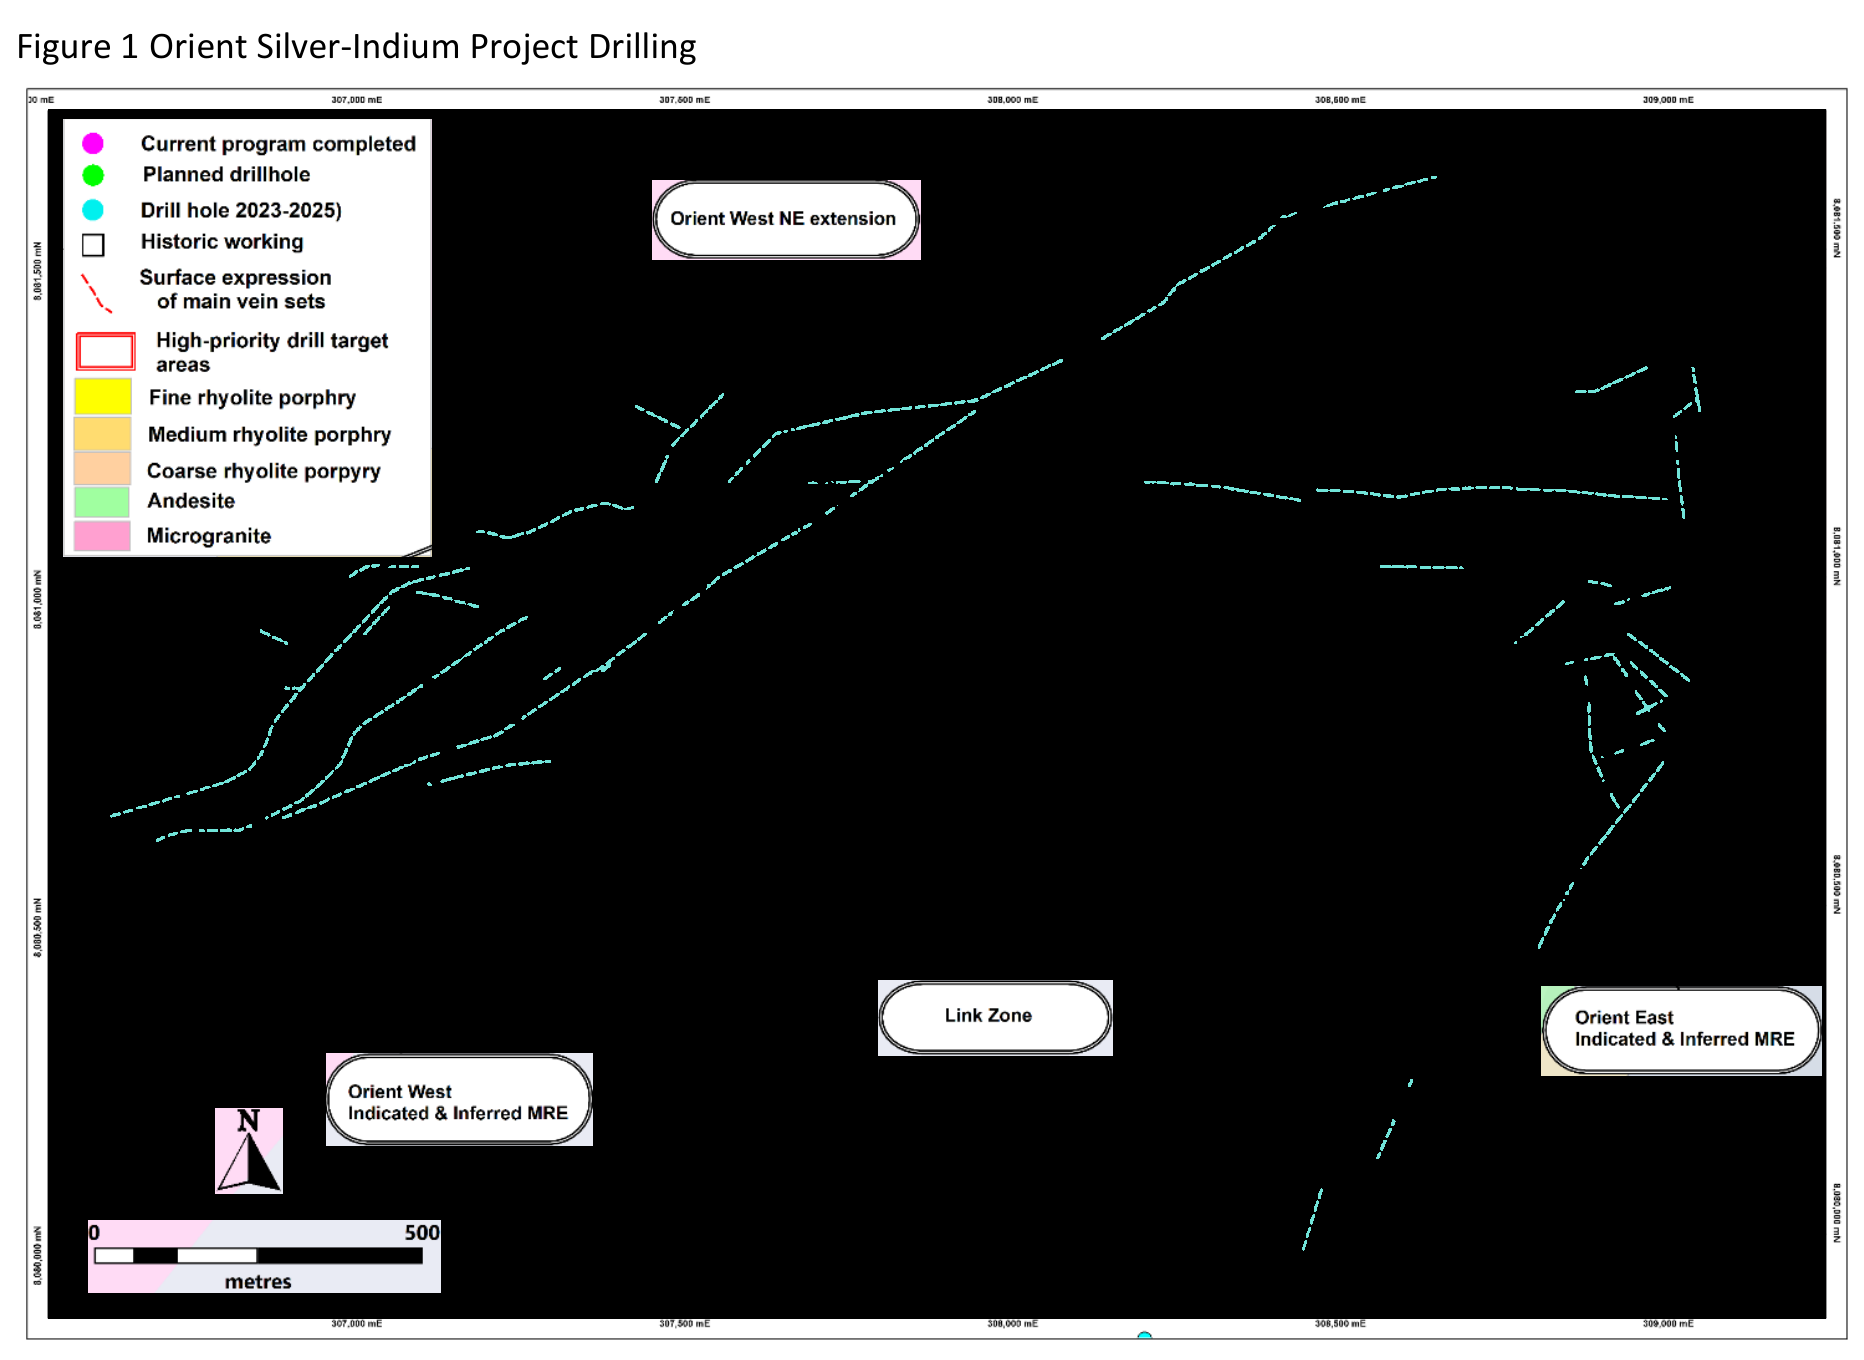
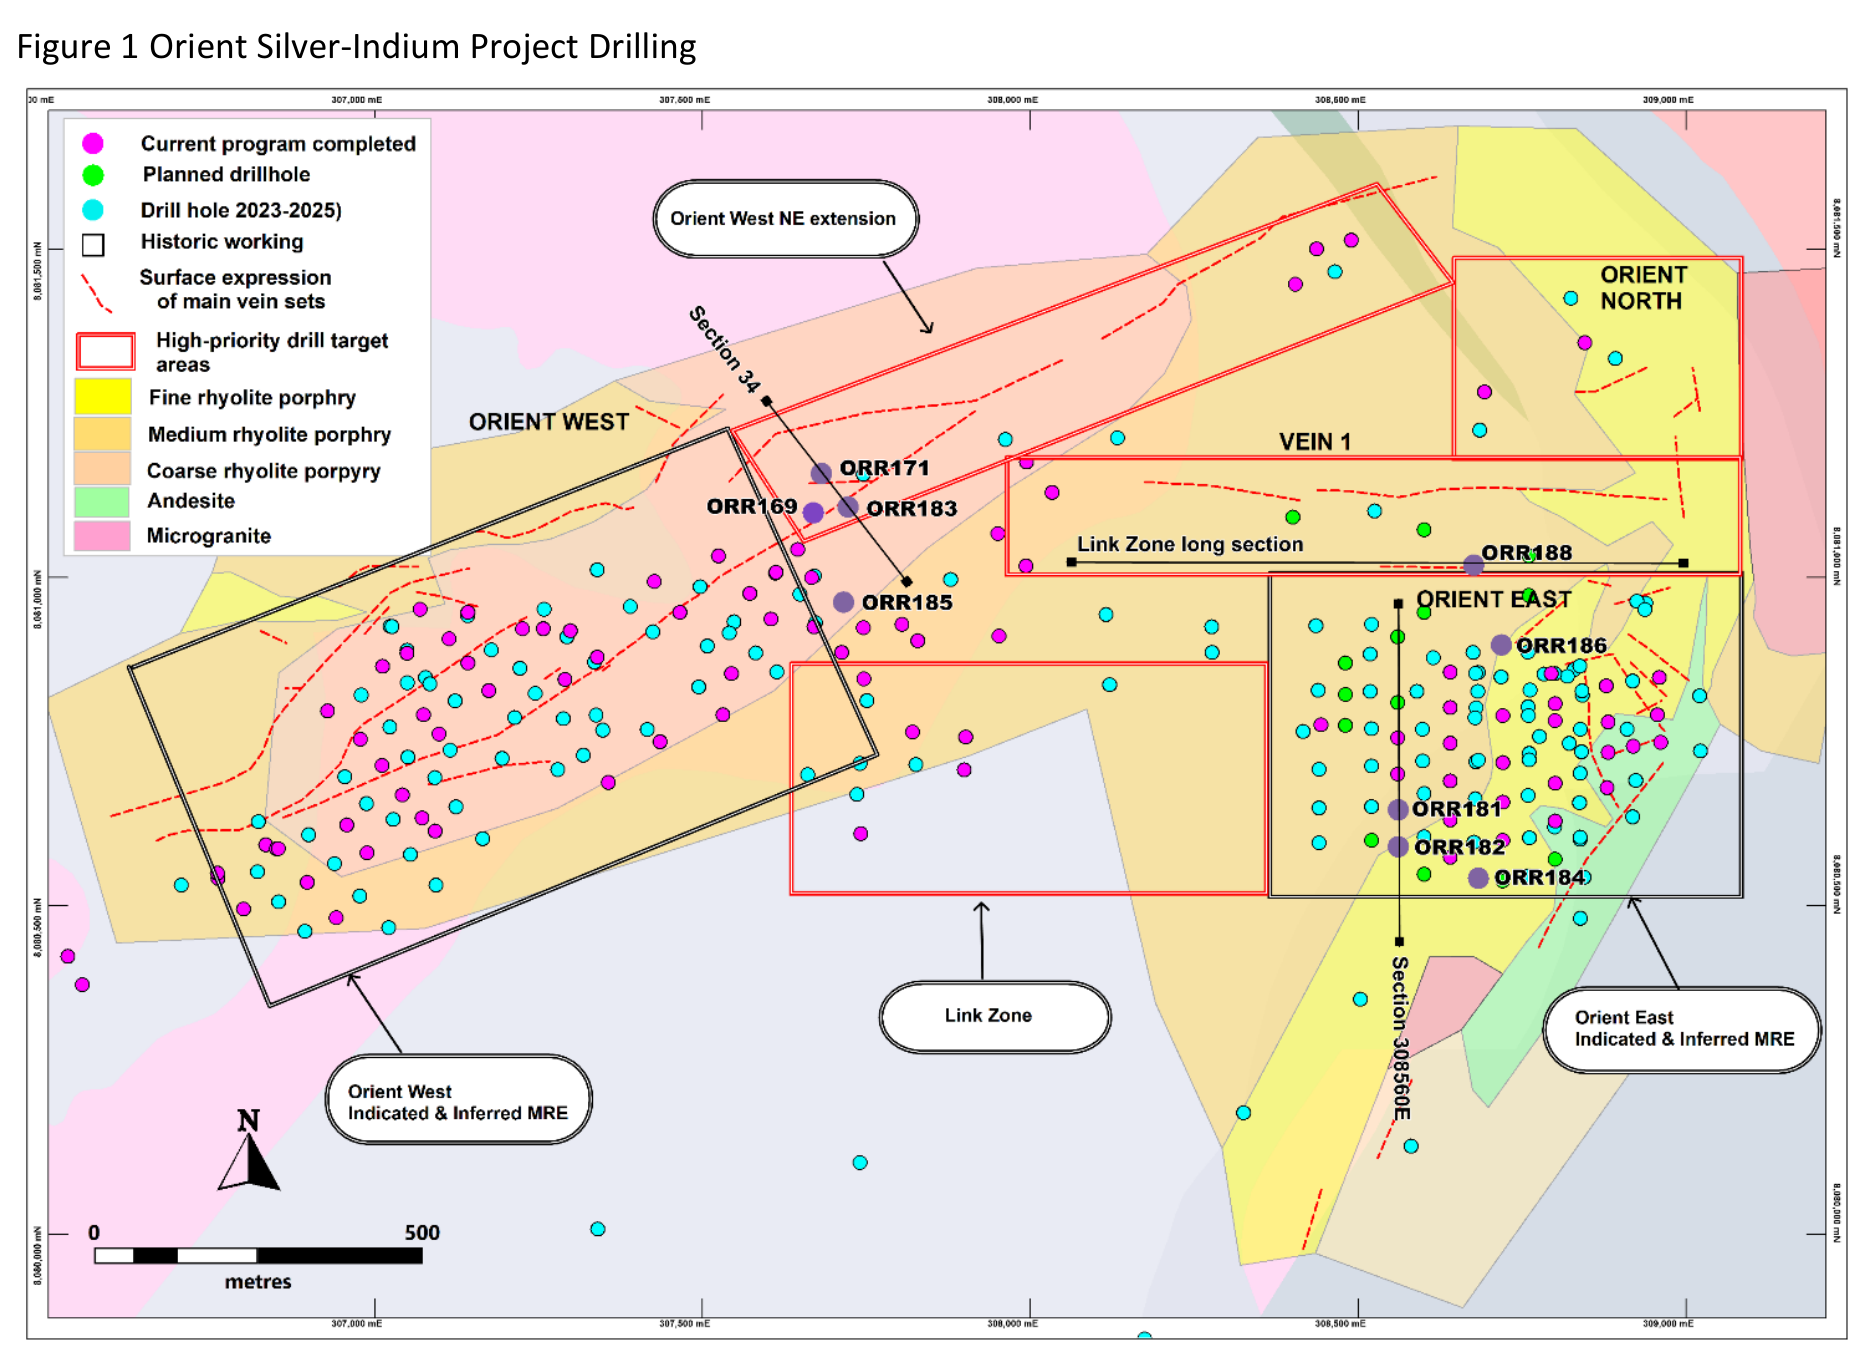
Drag the divider, or use the arrow keys to compare. Home shows the full extraction; End shows the full original.
The red dashed surface traces of the main vein sets are highlighted in cyan. The extraction separates them from the solid red drill-target boundaries and the coloured drill-hole symbols.
Source: Iltani Resources. ASX announcement.
Historical mines: Kalamazoo Resources, Ashburton
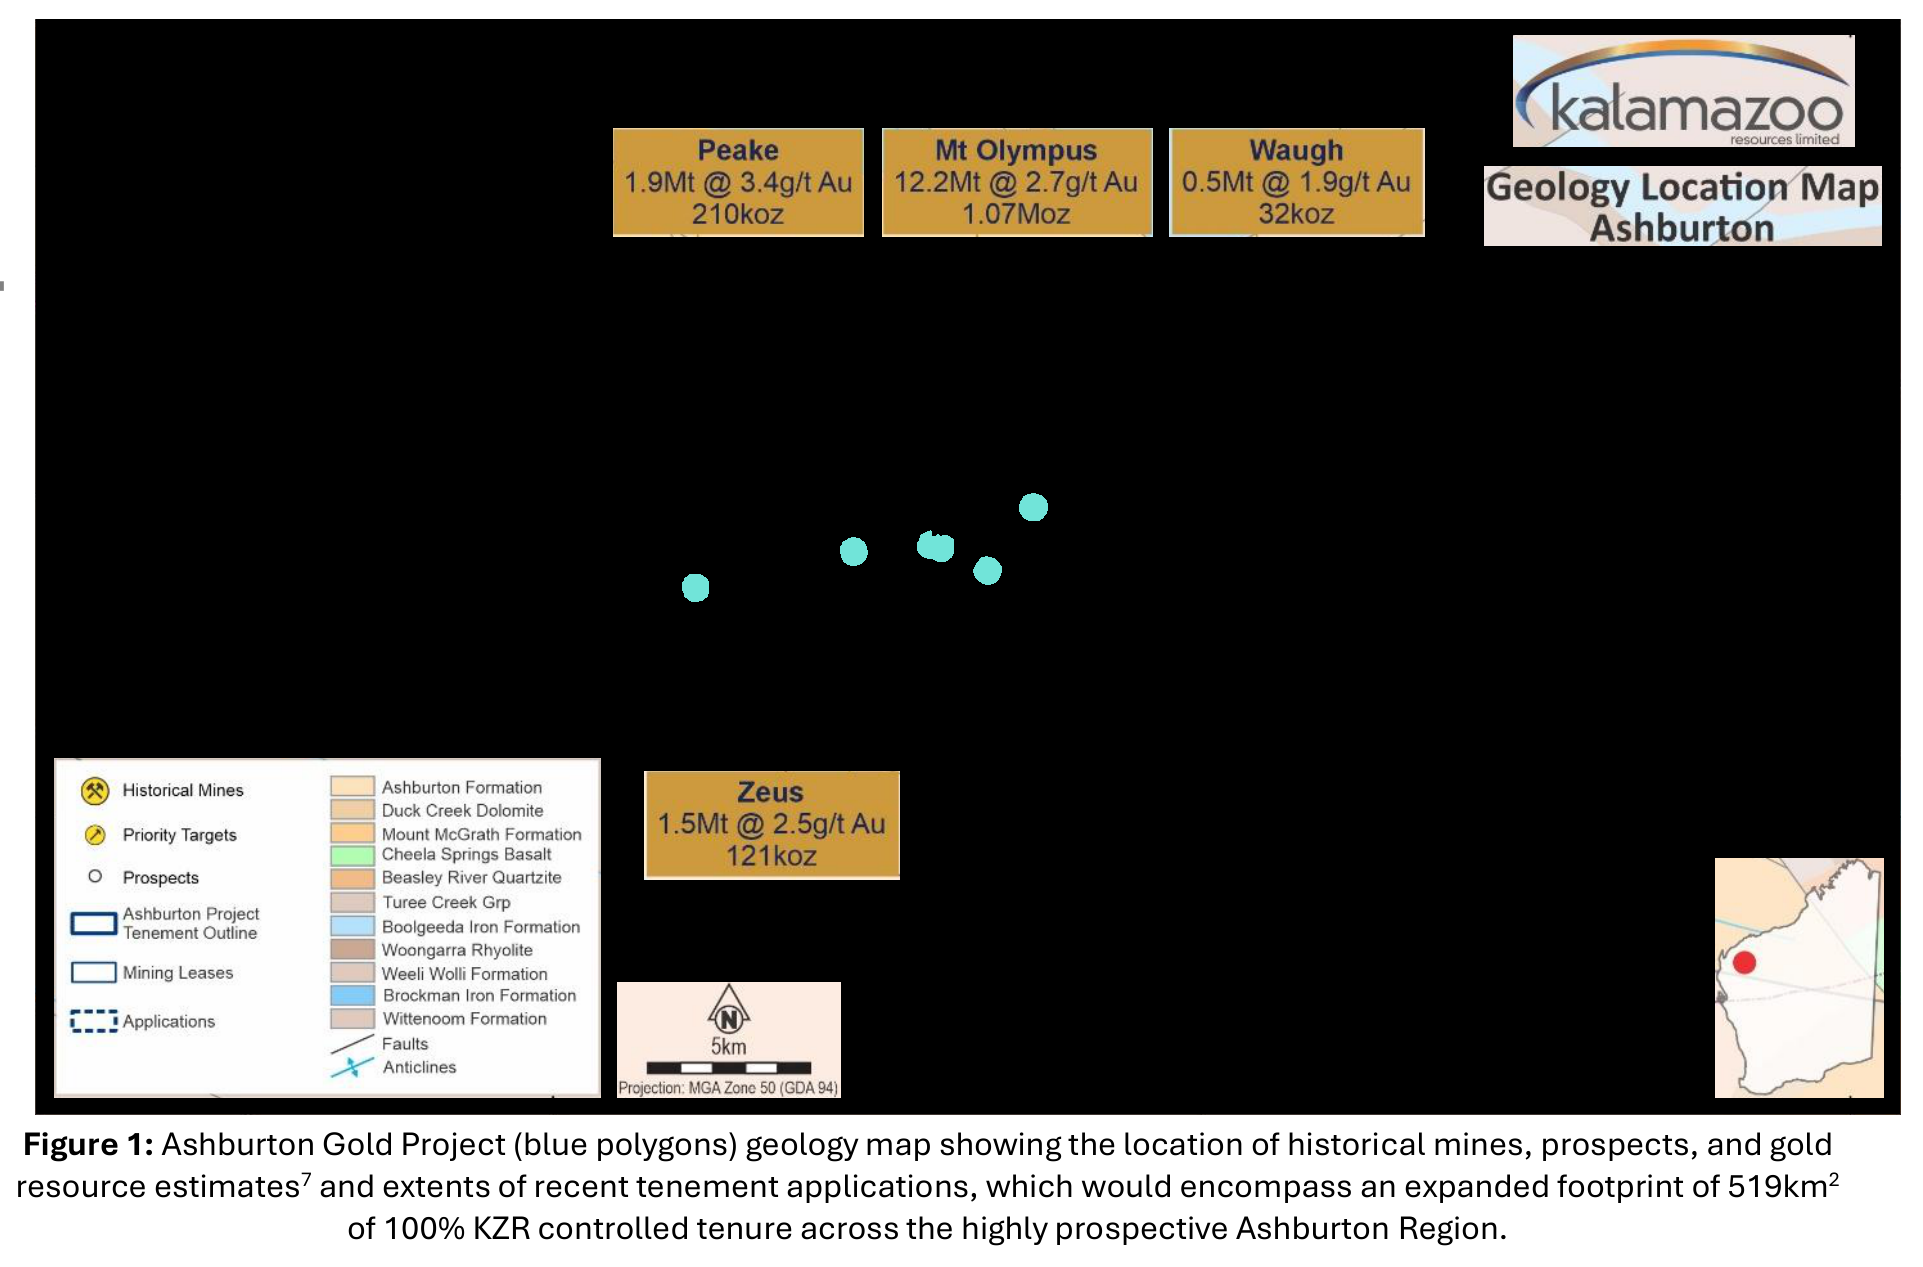
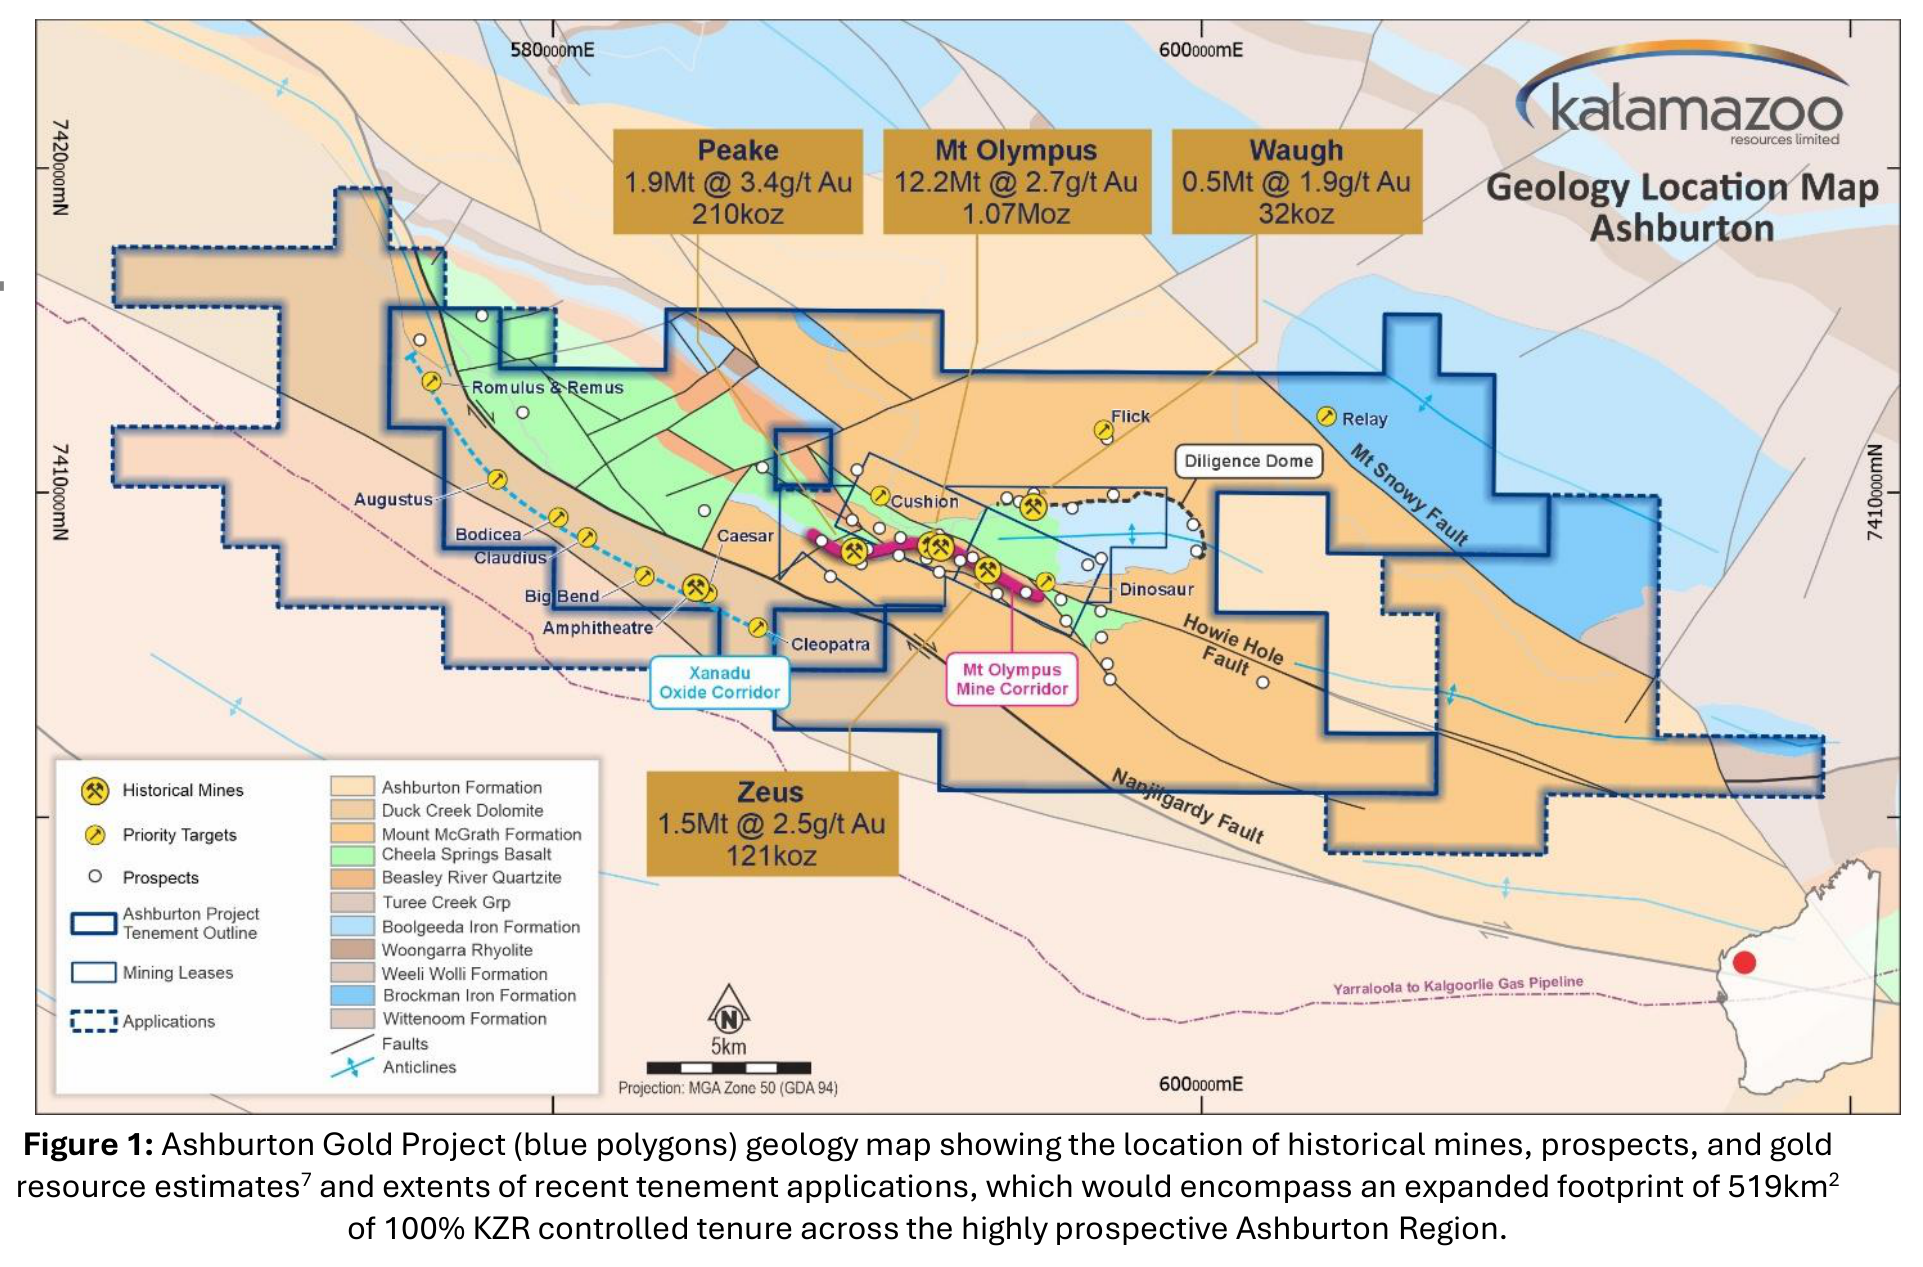
Drag the divider, or use the arrow keys to compare. Home shows the full extraction; End shows the full original.
Cyan markers isolate the historical mine symbols along the central corridor, including the closely spaced pair. The legend distinguishes these crossed-pick symbols from priority targets and prospects.
Source: Kalamazoo Resources. ASX announcement.
The Canadian survey and ASX demo extractions include reviewed corrections. They illustrate individual feature classes, not complete recovery of every feature on a sheet. Check extracted features against the source before using them.
Start with an uploaded map or report
- Upload your file to Files. Include the complete map, readable legend, coordinate labels, and projection information where available.
- Wait for indexing to finish. Map vectorization runs automatically for supported maps in customer uploads; there is no separate vectorization button to enable.
- Select the indexed file and choose View on Map. Expand the relevant data group in the Results panel to inspect the available source maps and extracted layers.
- Choose the source map's title or zoom control to focus on its footprint, then turn on the features you want to review.
Understand the extracted layers
| Feature | What the layer represents |
|---|---|
| Polygons | Areas such as mapped rock units, alteration zones, or labelled anomaly regions. |
| Lines | Supported linework such as faults, contacts, or interpreted structures. |
| Points | Supported map symbols such as sample locations or mineral occurrences. |
| Categories | The source legend's labels, such as rock type or enrichment class. |
| Numeric ranges | A value interval printed in the legend, such as an iron grade of 50–55%. The interval is retained instead of assigning an exact measurement. |
Layers are grouped with their source map, which may be labelled by page and image number. Available fields, units, and controls depend on the source. A Vectorized features or Vectorized ranges label identifies extracted map content; it is not an accuracy score.
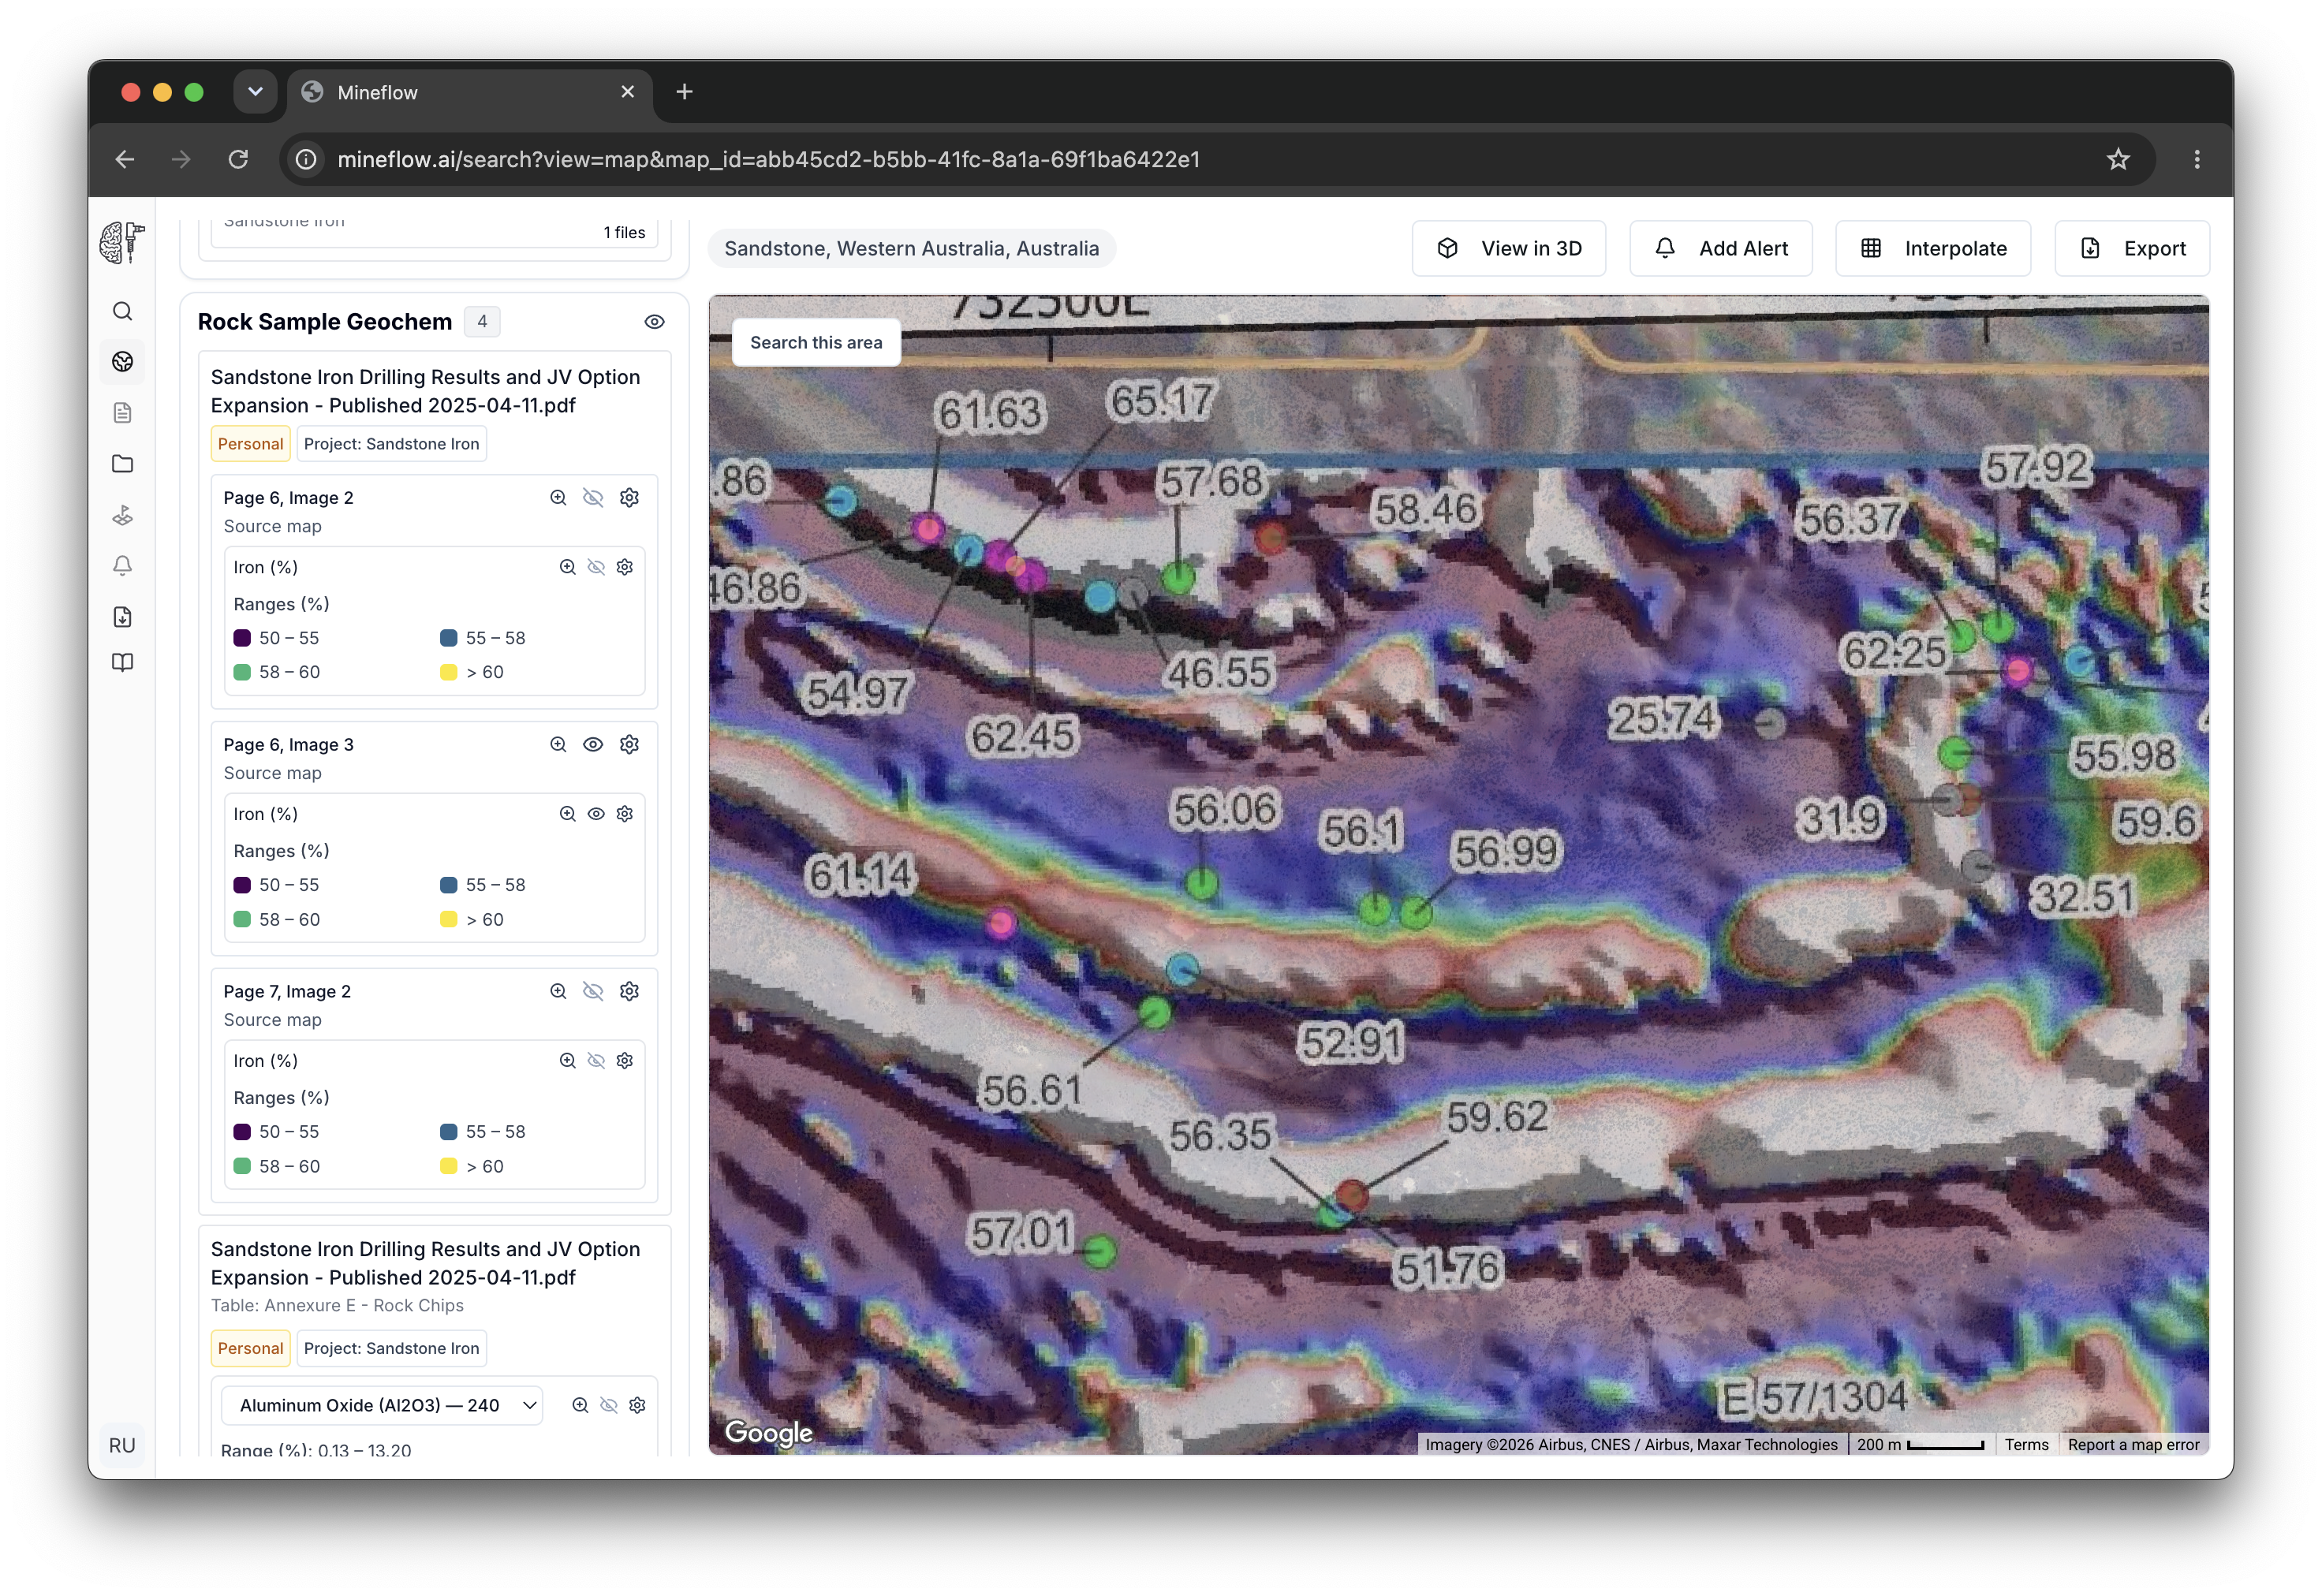
A coloured geophysical image does not automatically contain recoverable numeric measurements. Check the available fields and units before treating a colour or category as a survey value.
Compare features with the source
- Use Show source map and Hide source map in the source header to compare the original image with the extracted features.
- Open Source map settings and adjust opacity to compare the map's placement with the basemap and other layers. Try 40% opacity and leave just one or two extracted categories visible so the printed features remain easy to see.
- Use each extracted layer's visibility and legend controls to inspect the categories you need. Open its settings for the colour, variable, or range options available for that layer.
- Compare boundaries and symbols with the original map, especially around labels, fine linework, and small or overlapping features.
Scan quality, map scale, similar colours, overprinted text, and incomplete geographic references can limit extraction. Features may be missed or only partly traced. Zooming in does not add source detail, and successful processing does not establish geological accuracy.
These examples show plan-view maps. Cross sections use drillhole or map control points to position the image and its features in 3D. See Cross-section vectorization for examples and placement details.
Export the result for further work
Select Export from the map and review the layers included in the package. Choose a supported vector format, such as GeoJSON or Shapefile, when offered for your selection. Check the export layer list even if you have hidden layers on screen.
To take the source image into GIS, open its settings and choose Download georeferenced TIF when available. Keep the source attribution, coordinates, and units with the extracted data.