Cross-section vectorization
Bring cross sections from exploration reports into 3D, with the original image and extracted features positioned together alongside drilling.
Keep the section and its geology together
A published section can show rock units, interpreted structures, mineralised zones, and grade bands below the surface. Mineflow can extract supported features into separate layers and position them in 3D using the section's coordinate and drillhole evidence.
The original section image is placed on the same surface as the extracted features. Its labels, legend, assay graphics, and geological interpretation stay available while you compare the result with drilling. Turn the image and feature layers on or off independently to inspect their boundaries.
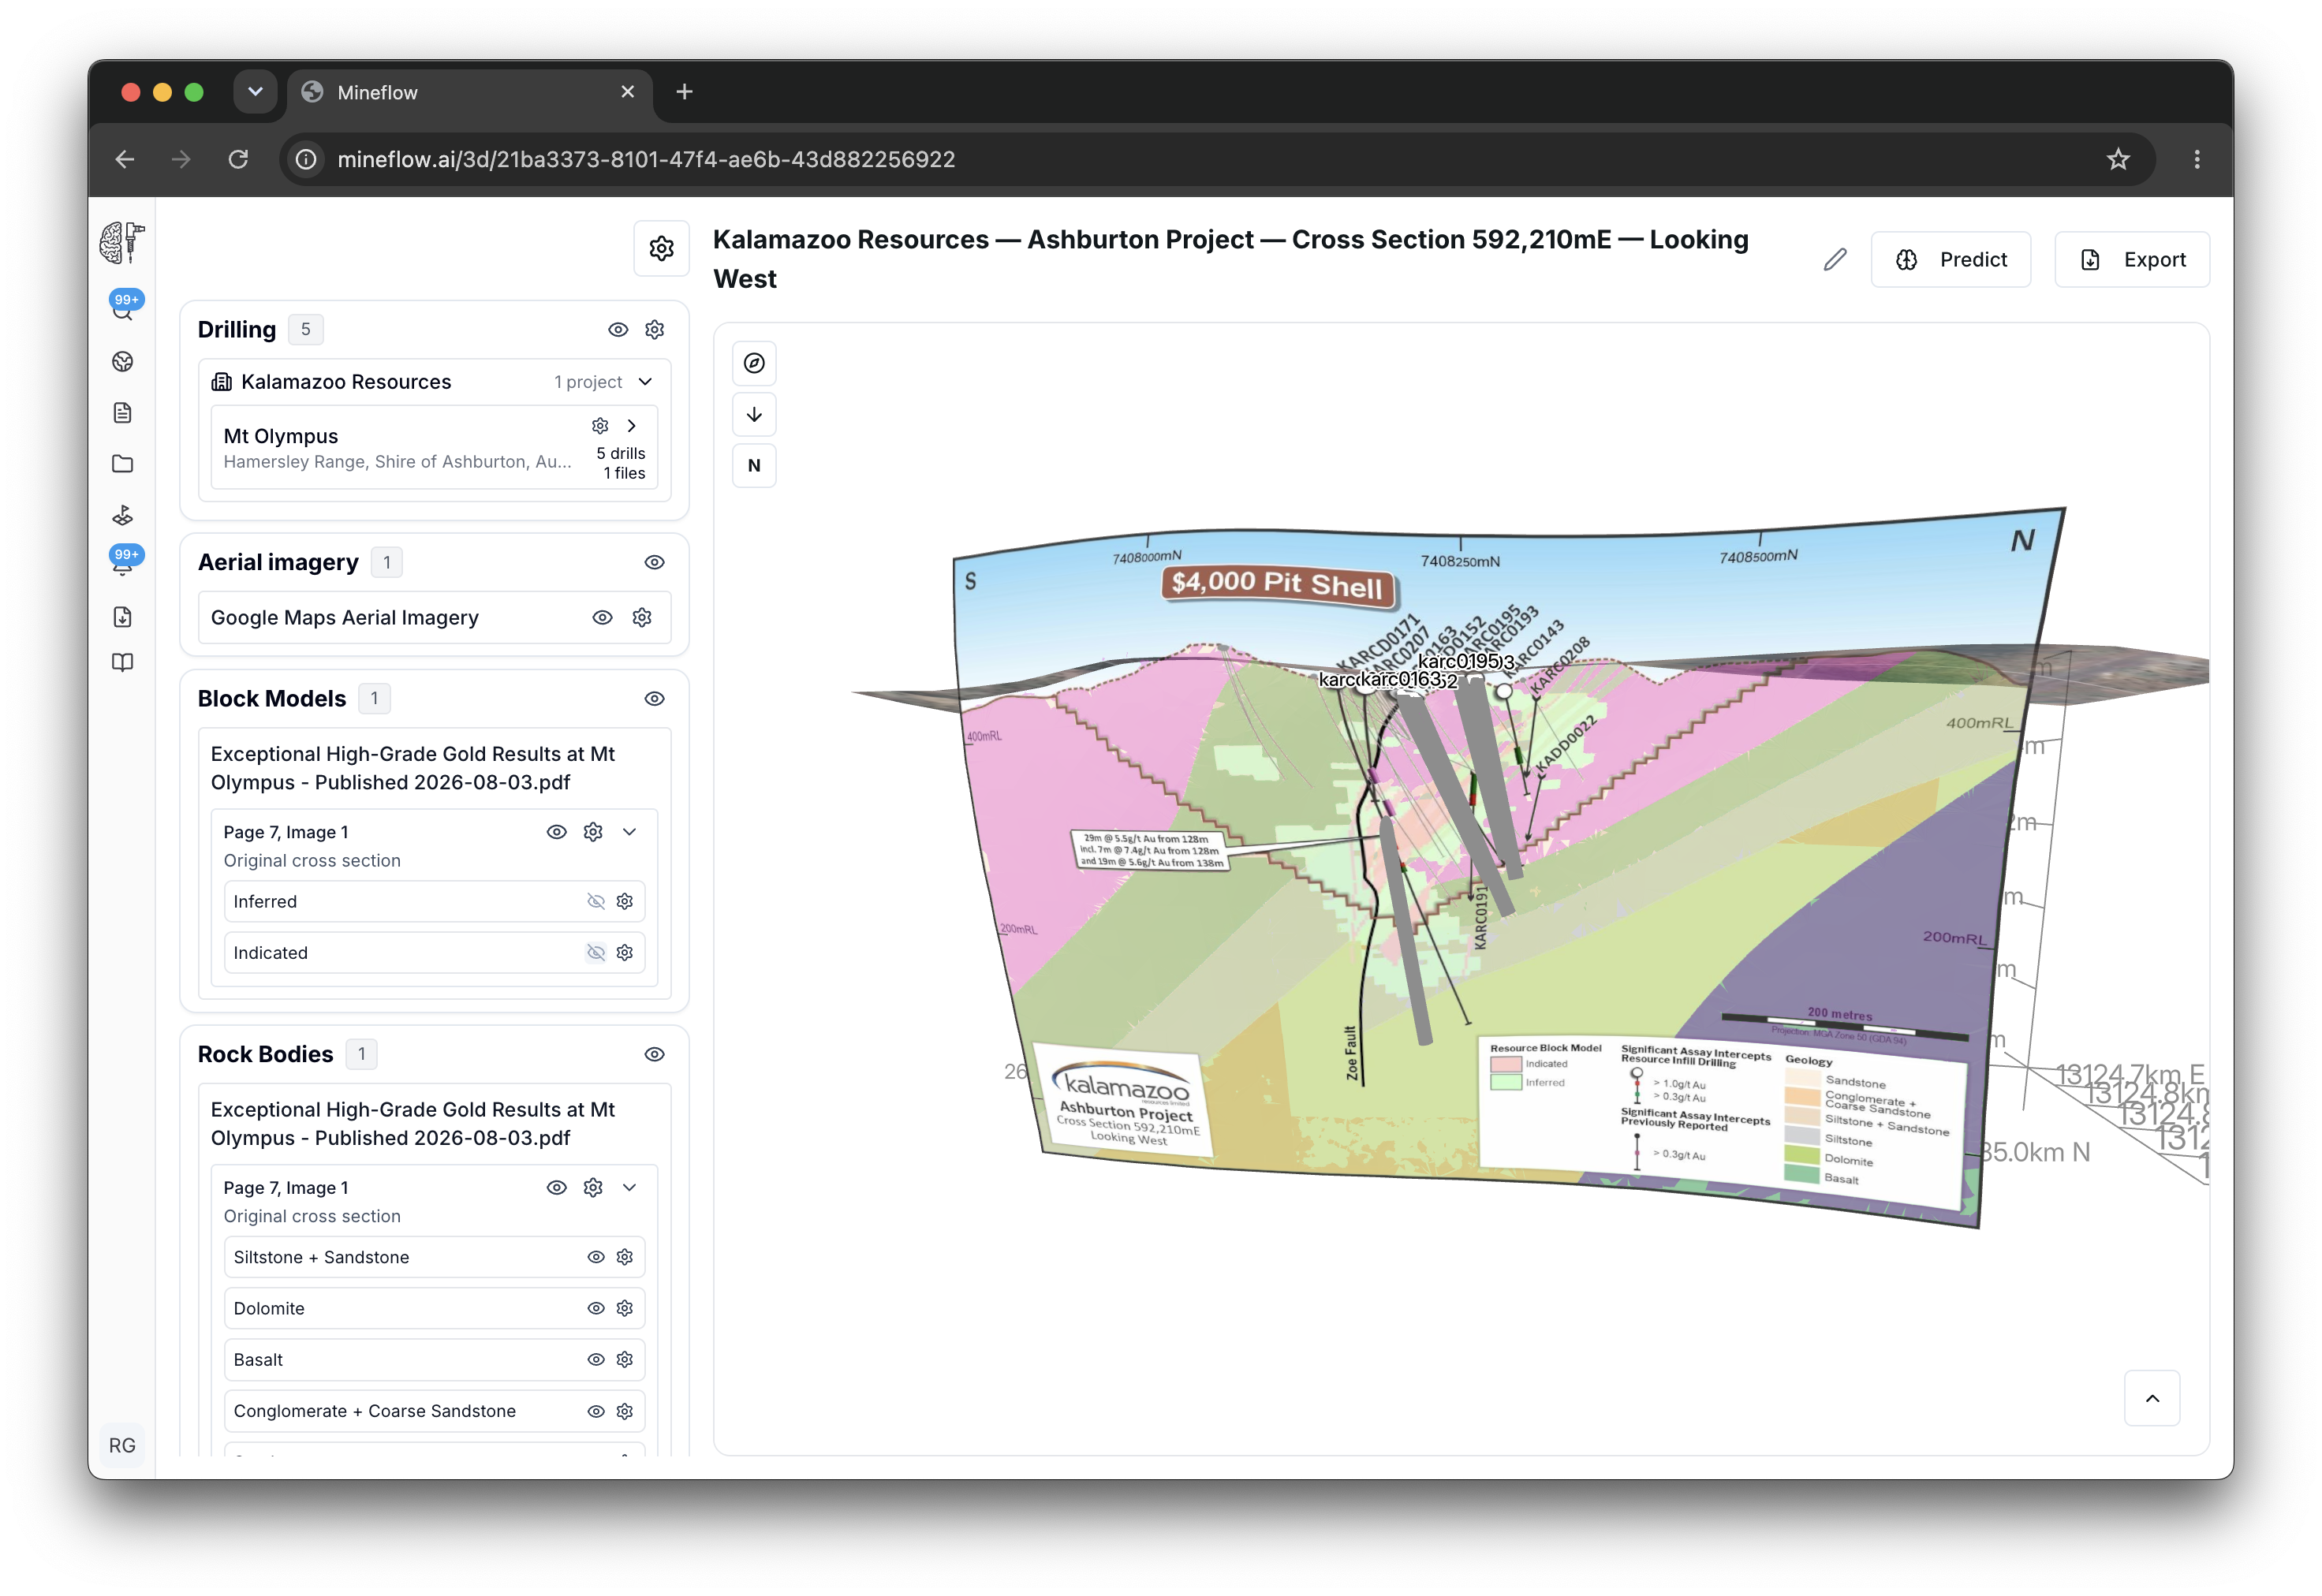
Mt Olympus: rock units in their section context
This Kalamazoo Resources section shows the geology at Mt Olympus in the Ashburton Project. Extracted units such as basalt, dolomite, and sandstone have their own visibility controls under Rock Bodies. The source figure remains attached to its document, page, and image.
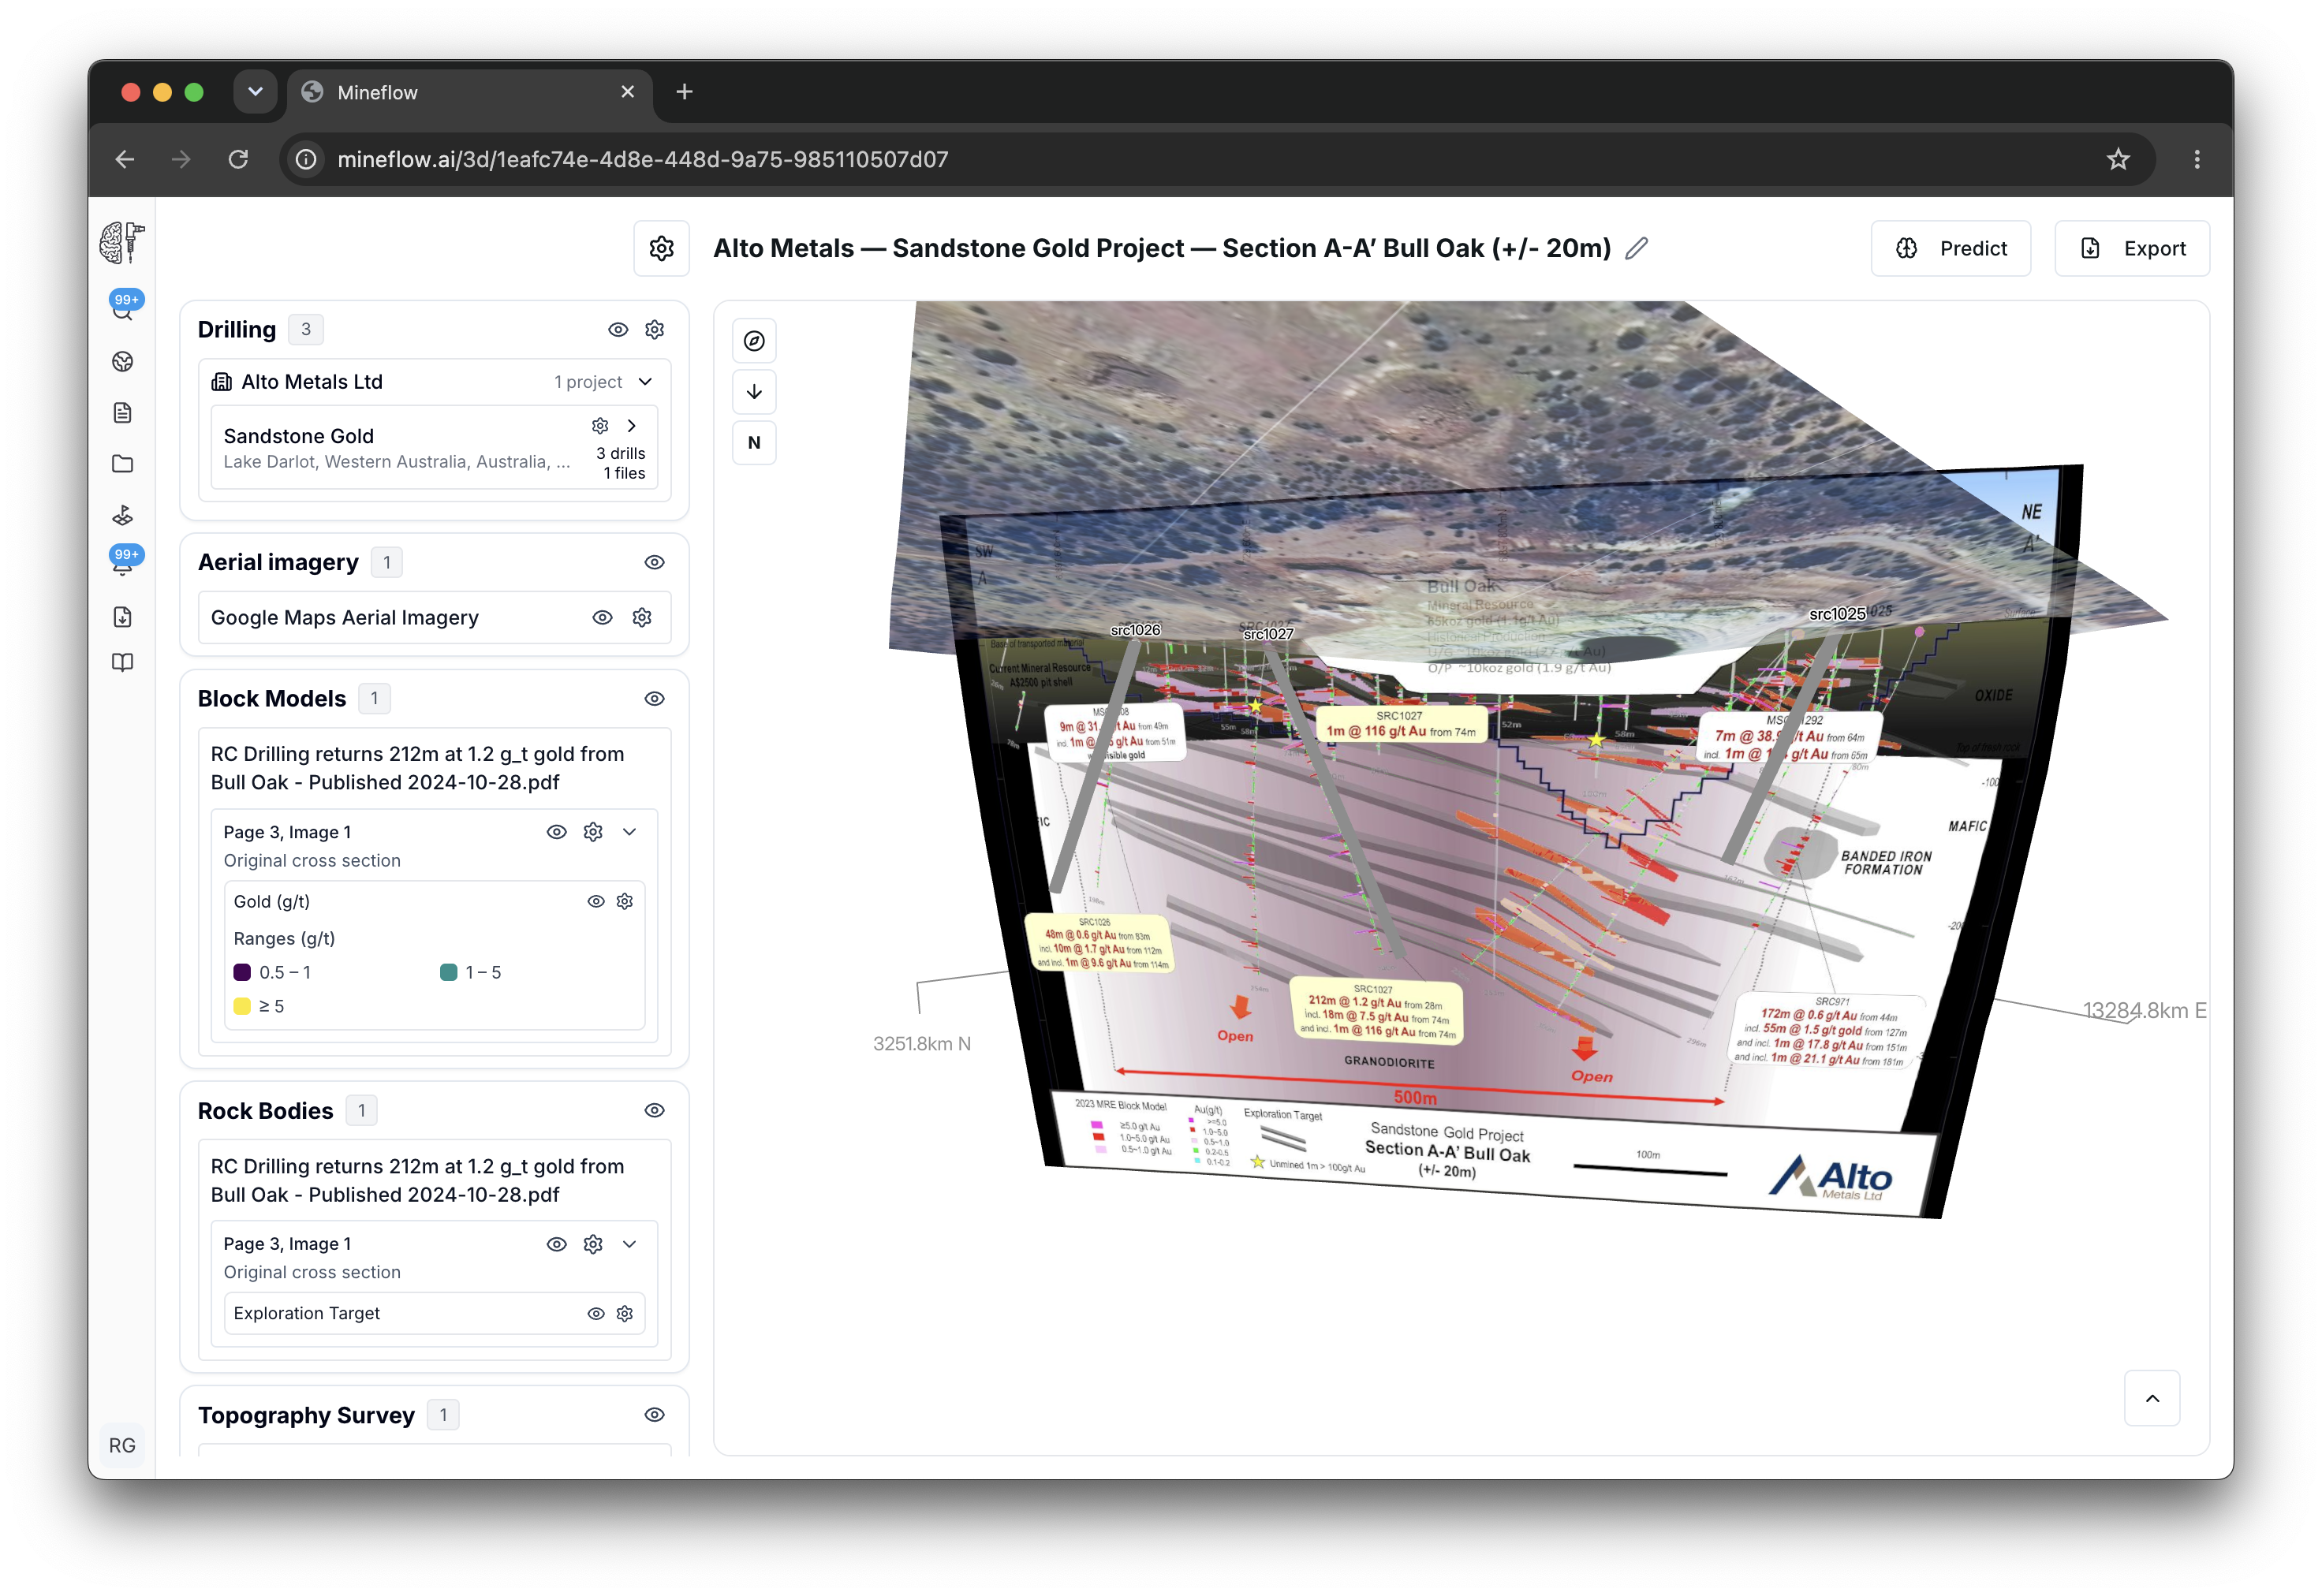
Bull Oak: one Gold field with its printed grade ranges
In Alto Metals' Bull Oak section, the gold bands form one measurement field. Gold is the element and g/t is the unit. The printed intervals—0.5–1, 1–5, and at least 5 g/t—remain ranges within that field, so you can review them together and change their display colours.
A section with one measurement shows its field directly, without an element selector. Range data keeps its bounds; it does not acquire an invented exact grade.
How a section is positioned in 3D
Placement starts with identifiable points in the figure and evidence that locates them in the real world. Printed distance and elevation axes help establish the section's scale. There are two supported sources of placement controls:
| Control source | How it locates the section |
|---|---|
| Drillhole controls | Match labelled holes or downhole positions to known collar coordinates, dip, azimuth, and depth. These provide 3D points against which the section can be fitted. |
| Map controls | Match section endpoints or labelled stations to their positions on a georeferenced map. The section trace and printed vertical scale establish its position and elevation. |
A section can be tilted or curved to follow its controls. The original image and all extracted features use the same fitted surface, so they remain aligned as you rotate the scene. If the available evidence cannot support a placement, the extraction is retained in image coordinates for review.
Controls constrain the fit where they occur. Matching them does not independently verify the section's orientation or the geology between them; collar-only controls in particular may leave subsurface orientation uncertain.
Review the image, features, and drilling
- Expand a source document and its Page and Image group in the 3D layer panel.
- Use the visibility control beside Original cross section to compare the extracted geometry with the printed figure. Check boundaries where labels or drill traces cross a coloured region.
- Show the rock units, structures, or measurement fields you need. Their settings control colour and opacity independently of the image.
- Rotate the scene to inspect its relationship with drilling. Use Drill Assay to colour holes when indexed interval assays are available.
These examples illustrate selected extracted features, not complete recovery of every mark in a figure. Text can leave gaps in a mask, and repeated colours can include unrelated graphics. The retained source makes those differences visible. Assay graphics printed on the image remain source context; the Drill Assay controls use separately indexed interval data.
On the 2D map, section layers currently show their geographic bounding footprint. Open the 3D view to inspect the positioned image and actual feature geometry.
Related guides
For ordinary plan maps, see Map vectorization. To work with drilling and other layers in a scene, continue with these guides.