Generating Predictions
How to generate mineral predictions from your visualization.
Overview
Mineflow allows you to generate predictions directly from your 3D visualizations. You can choose from a variety of models to predict mineral potential, lithology, or other properties of interest in your exploration area.
Generating Predictions
Create a visualization
Start by creating a 3D visualization of your drill data.
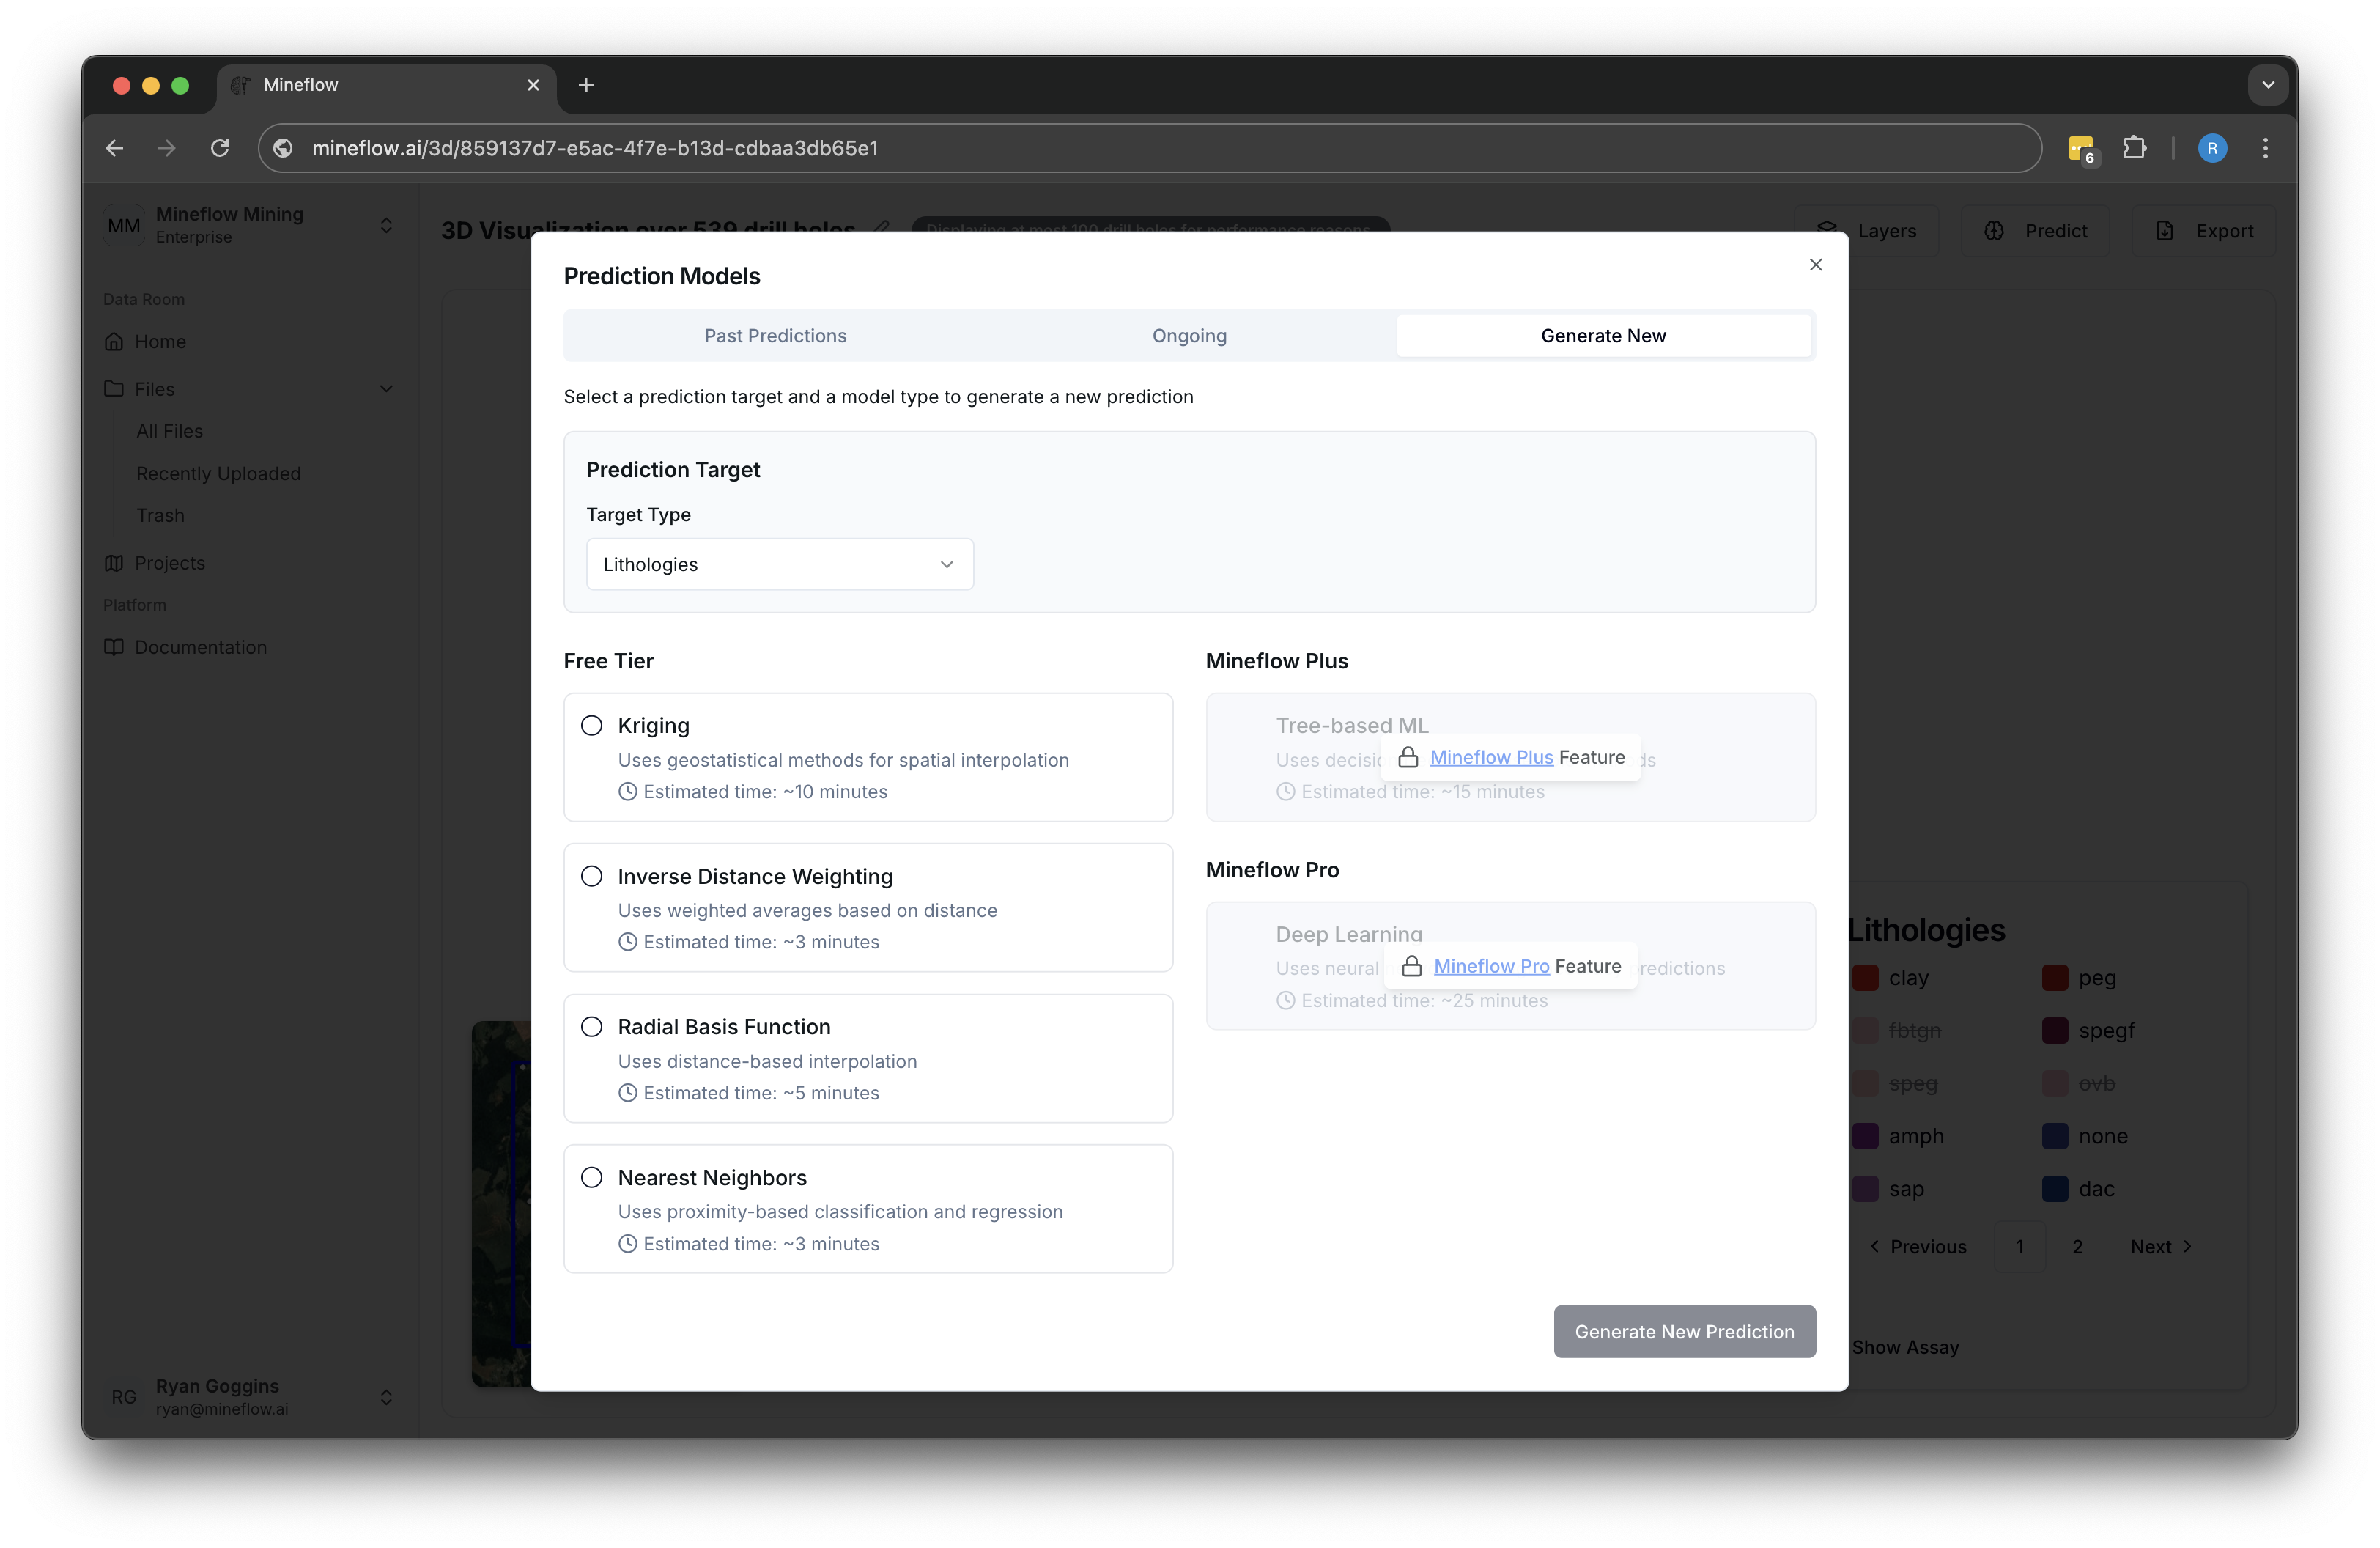
Select prediction in the visualization controls
From your visualization, access the layer controls and select "Generate prediction".
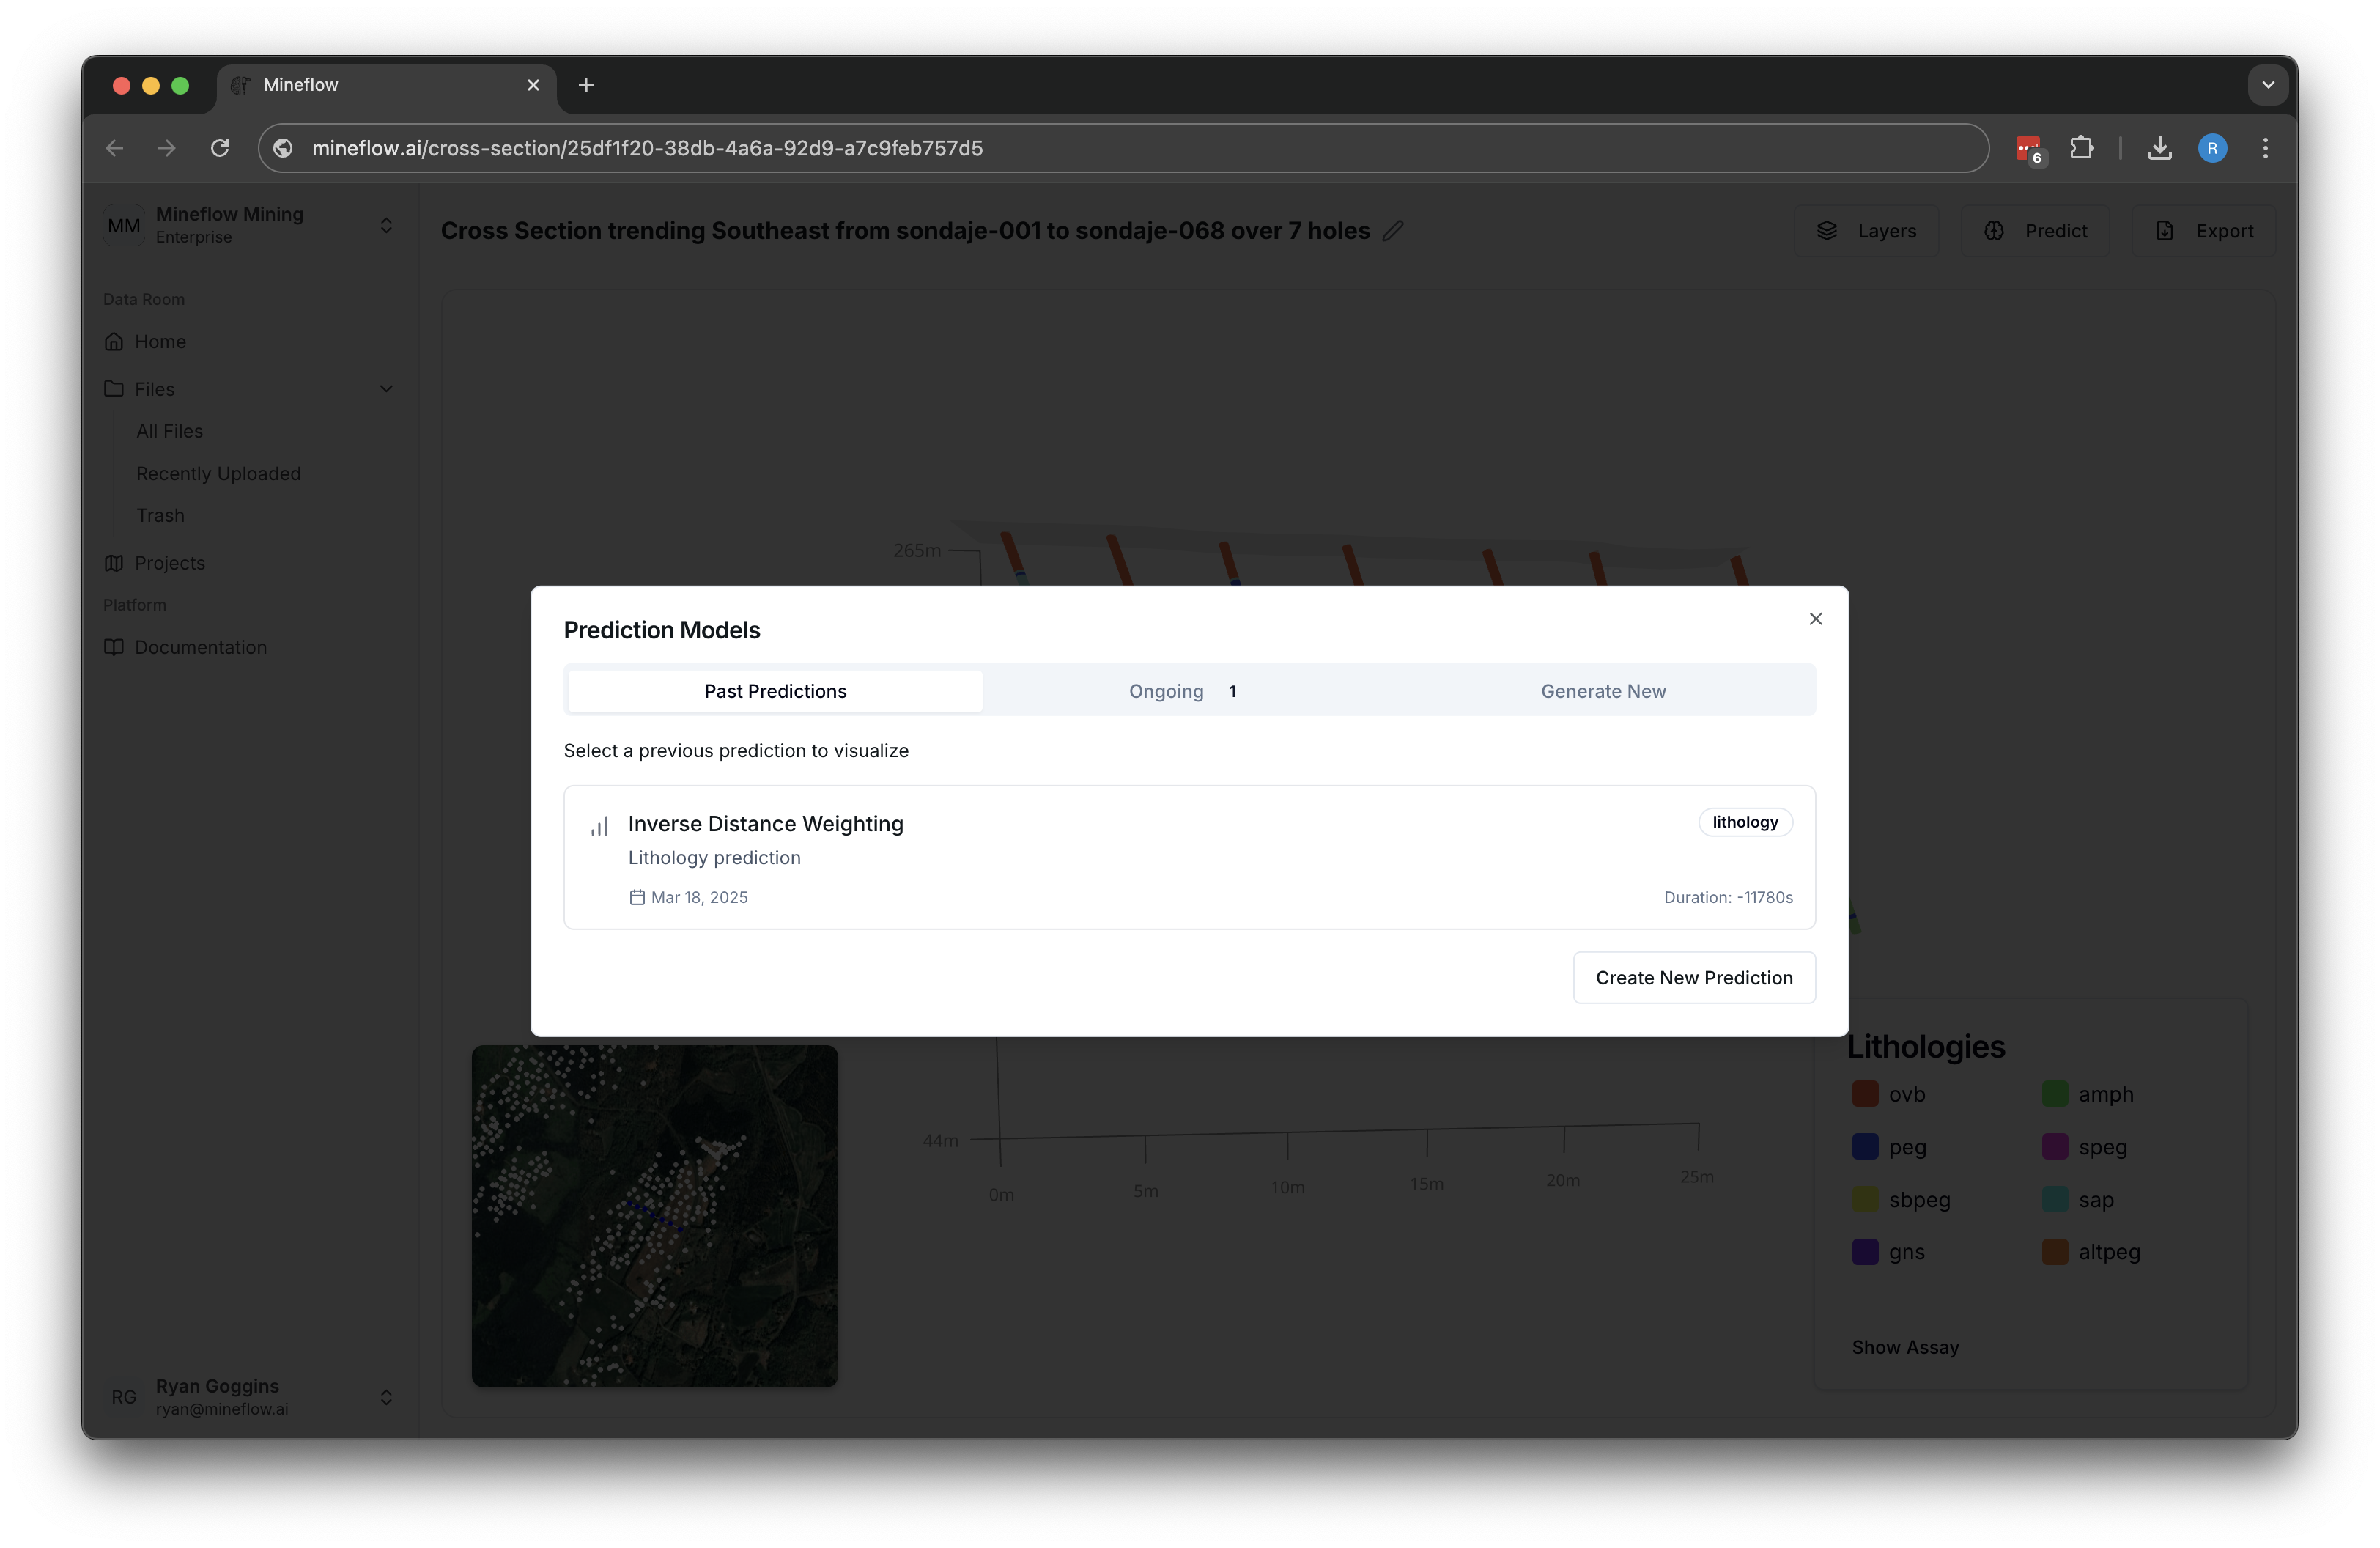
View past predictions
You can also access previously generated predictions.
View your prediction results
After processing, your predictions will be displayed directly within your visualization, allowing you to see patterns and potential targets.
Prediction Visualization
3D Predictions
3D predictions provide a volumetric representation of mineral potential:
3D predictions allow you to visualize the predicted mineral distribution throughout the volume of interest.