Maps and survey layers
Bring geological maps, geophysics, surface samples, and other spatial context into the same view as drilling.
Find a map or survey
Search for a place and data type, select the relevant Data Groupings, or open an indexed file with View on Map. Expand its group in the Results panel to see the available layers.
Mineflow uses the term non-drill data for map and survey layers outside the drillhole dataset. It includes both image-like grids, called rasters, and points, lines, or polygons, called vectors.
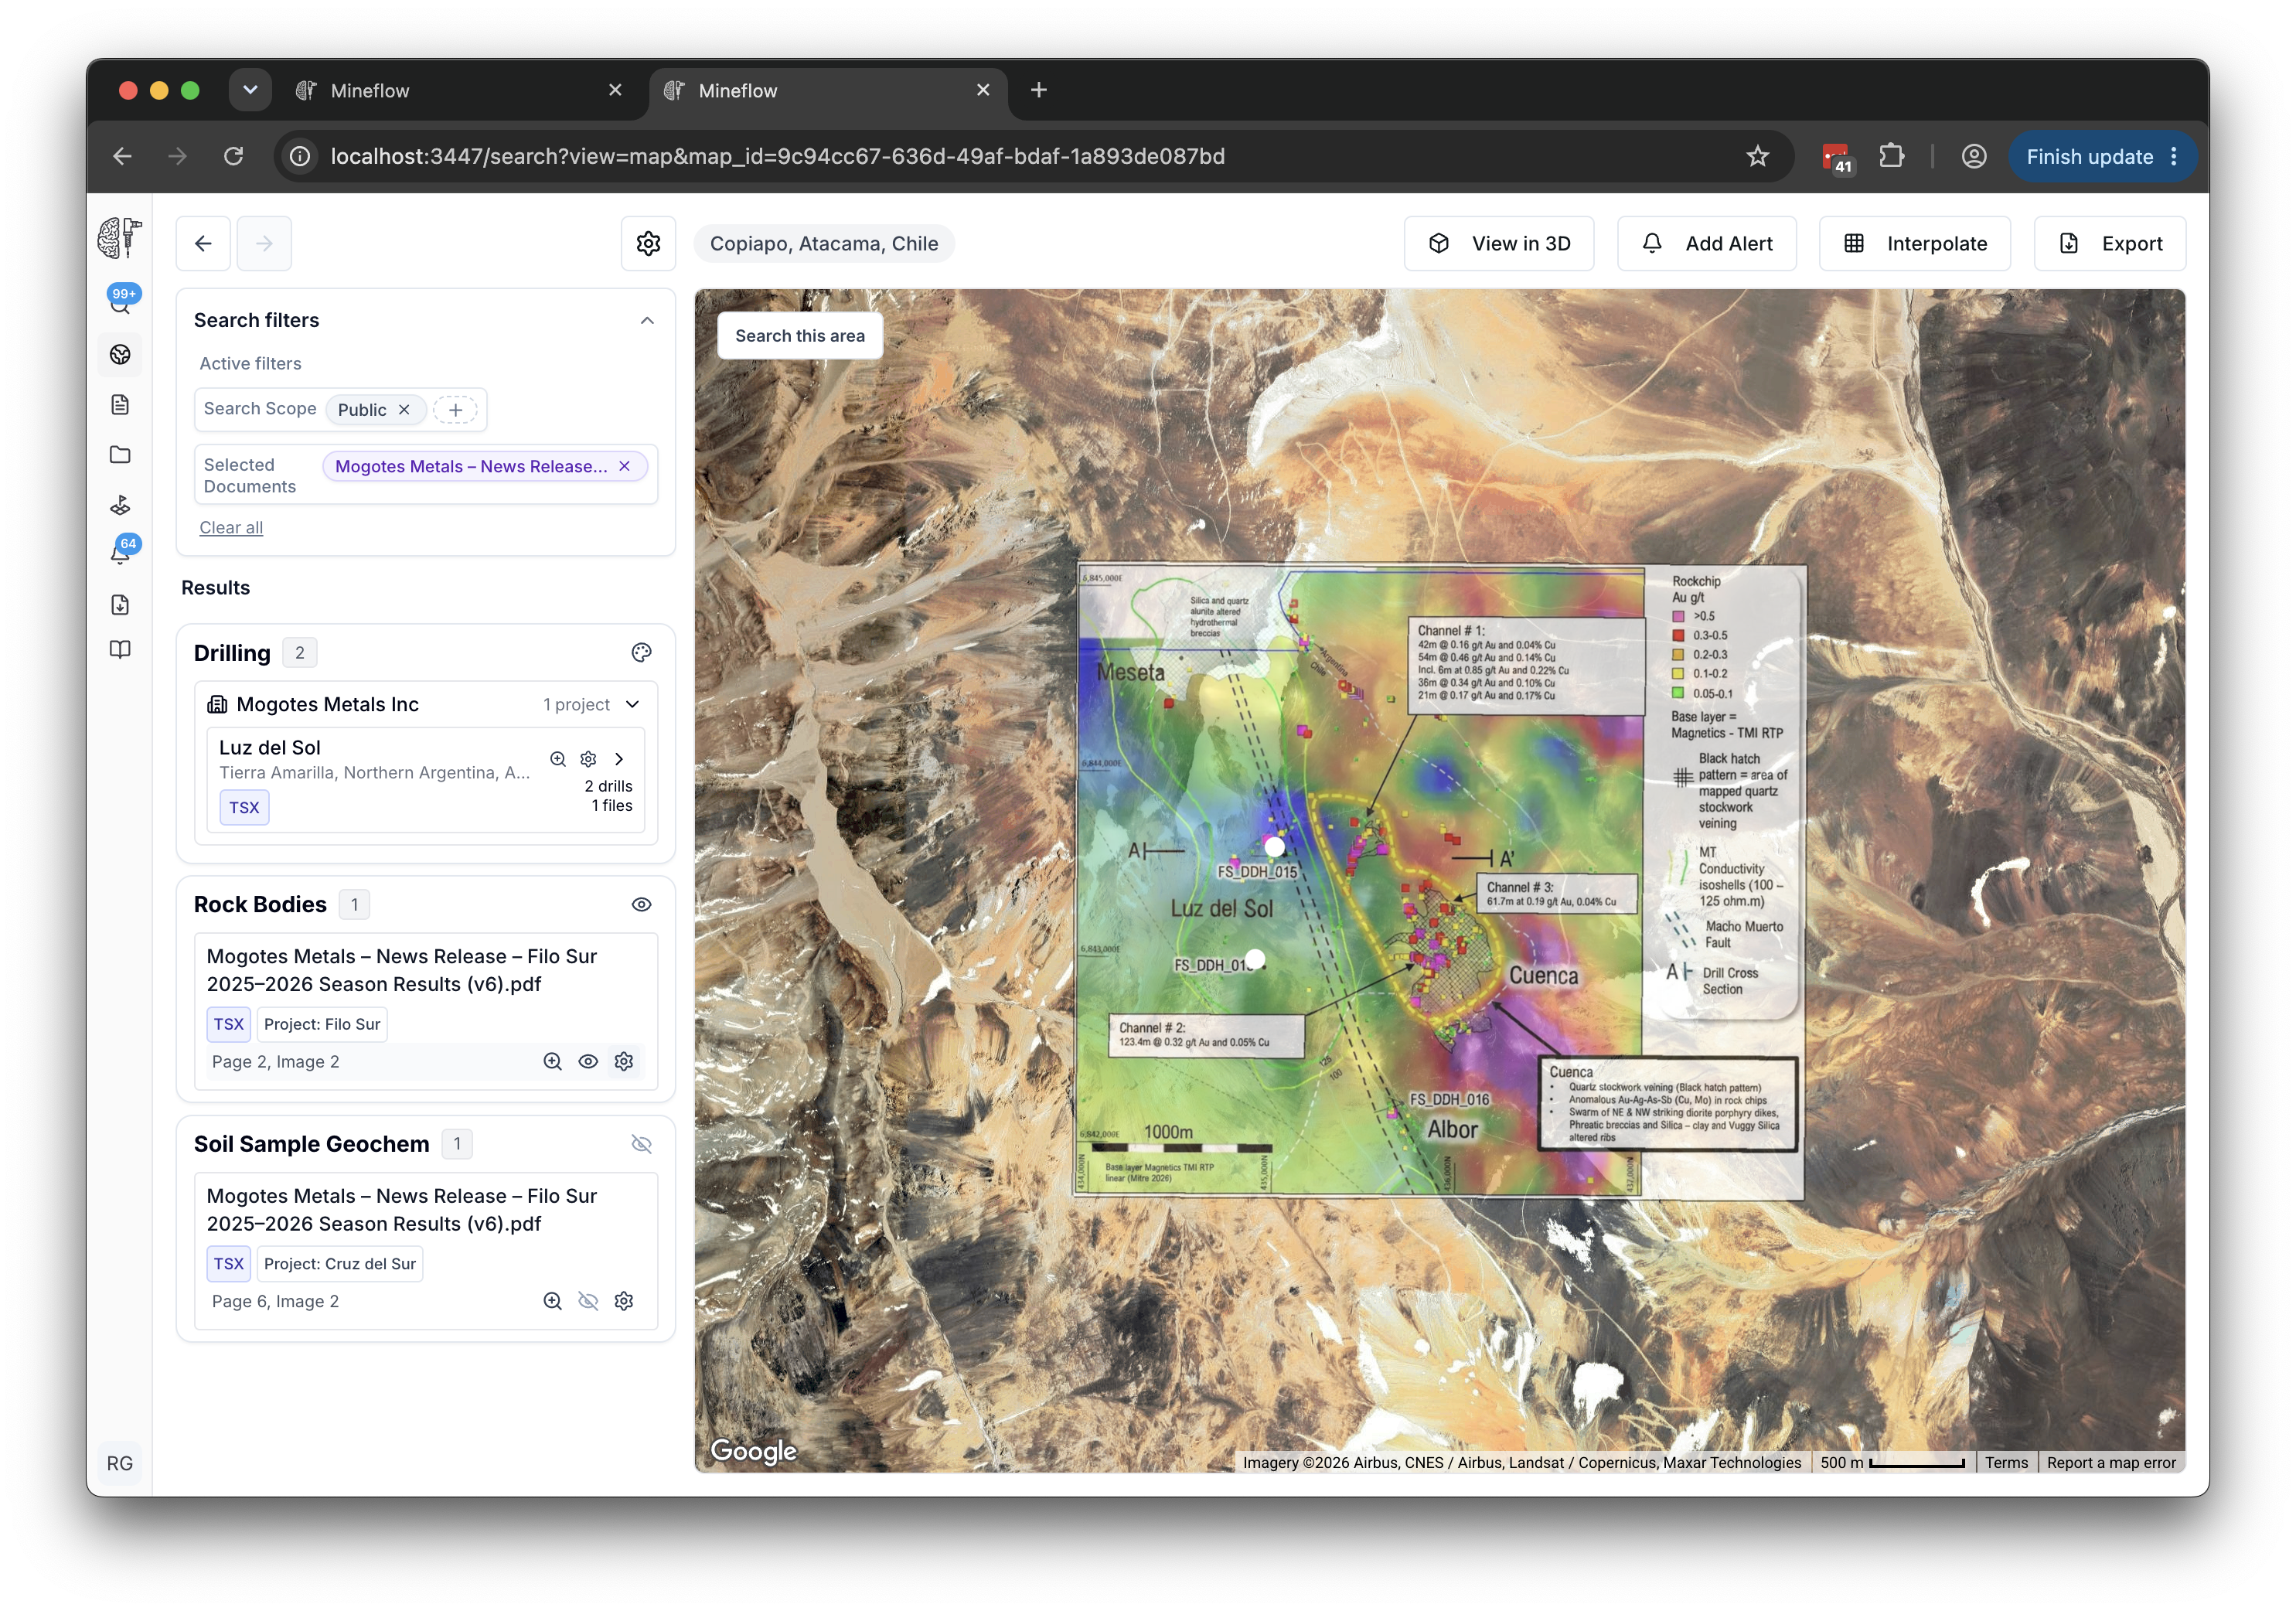
What you can compare
| Data | Typical use |
|---|---|
| Geological maps and interpreted boundaries | Compare mapped units, faults, and contacts with drilling. |
| Magnetics, gravity, radiometrics, and EM | Review available grids, measurements, and survey linework alongside geology. |
| Rock and soil geochemistry | Inspect surface sample locations, measured variables, and units. |
| Mineral occurrences | Locate recorded prospects, deposits, and historical workings. |
| Topography | Understand relief and the surface context of the exploration area. |
| Maps extracted from reports | Place historical mapping alongside newer data and return to the original report. |
The controls available depend on the layer and the information in its source. A coloured map image does not necessarily contain recoverable numeric survey values.
Read and adjust a layer
- Turn on the layer and use its focus control to zoom to its footprint.
- Open layer settings and inspect its source, available fields, and units.
- Use opacity to compare it with the basemap or another survey.
- For numeric layers, choose the variable and available colour or range controls.
Keep source scale and resolution in mind. Zooming in makes a layer larger on screen; it does not add detail to the original survey.
Interpolate supported surface measurements
Some point layers offer interpolation from their layer controls. Choose the measured variable, method, and raster resolution, then inspect the resulting layer alongside the original samples. The result estimates values between observations.
Point spacing and the chosen area affect how much confidence you can place in detail between samples. Review the source units before comparing the result with another survey.
Take the layer into the next task
For a georeferenced image, use Download georeferenced TIF when the layer offers it. For satellite band comparisons, use the separate spectral imagery controls.